Generating feature stacks#
Machine learning algorithms such as Random Forest Classifiers, e.g. as implemented in APOC use feature stacks for pixel classification. Feature stacks are lists of images of the same size (2D or 3D). APOC brings a utility function for generating feature stacks. It takes an image and a feature specification string as input to produce a feature stack.
Let’s start with loading an example image and making a convenience function for visualization:
from skimage.io import imread, imshow
import numpy as np
import apoc
import matplotlib.pyplot as plt
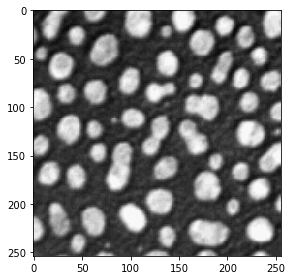
We start again with the blobs example image.
image = imread('../../data/blobs.tif')
imshow(image)
<matplotlib.image.AxesImage at 0x7f9ba9333580>
We furthermore define a utility function for visualizing feature stacks.
def visualize(feature_stack):
    """
    Shows lists of images in rows of three
    """
    if len(feature_stack) == 0:
        return

    # show feature images
    width = 3
    height = int(len(feature_stack) / 3)
    if height * width < len(feature_stack):
        height = height + 1

    fig, axes = plt.subplots(height, width, figsize=(10,10))

    for i, f in enumerate(feature_stack):
        if height > 1:
            axes[int(i / 3)][i % 3].imshow(f, cmap=plt.cm.gray)
        else:
            axes[i].imshow(f, cmap=plt.cm.gray)

    w = len(feature_stack) % width
    if w > 0:
        w = width - w
        while (w > 0):
            if height > 1:
                axes[-1][width - w].set_visible(False)
            else:
                axes[width - w].set_visible(False)
            w = w - 1

    plt.show()
Feature stacks#
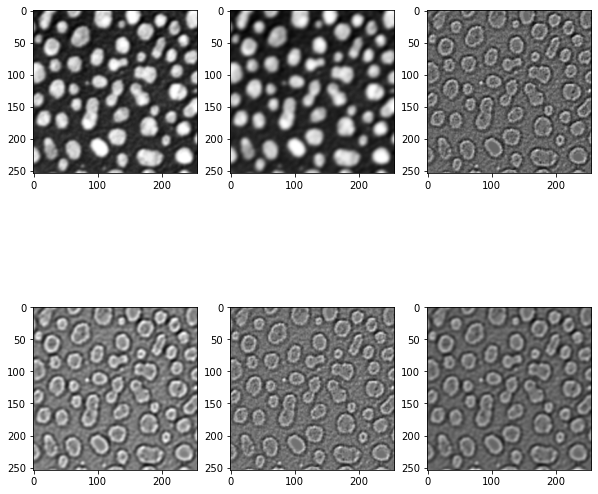
A feature stack is a list of 2D or 3D images, typically derived from an original image. If you don’t specify any feature specfication, a stack will be generated with the original image, a blurred version and an edge image:
feature_stack = apoc.generate_feature_stack(image)

visualize(feature_stack)

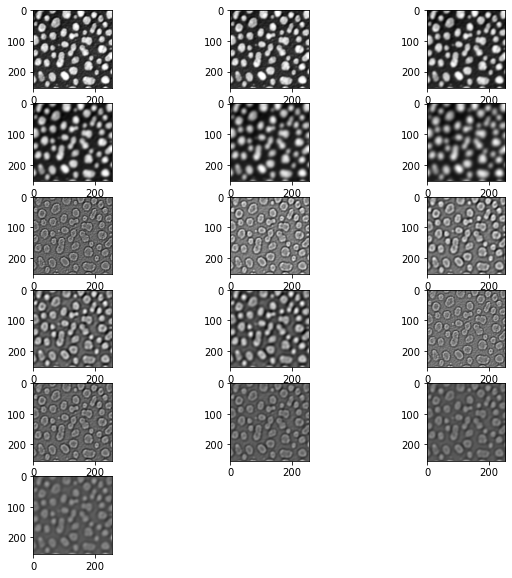
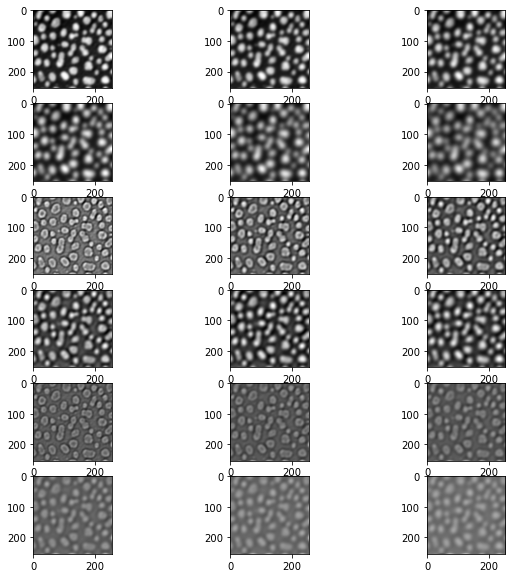
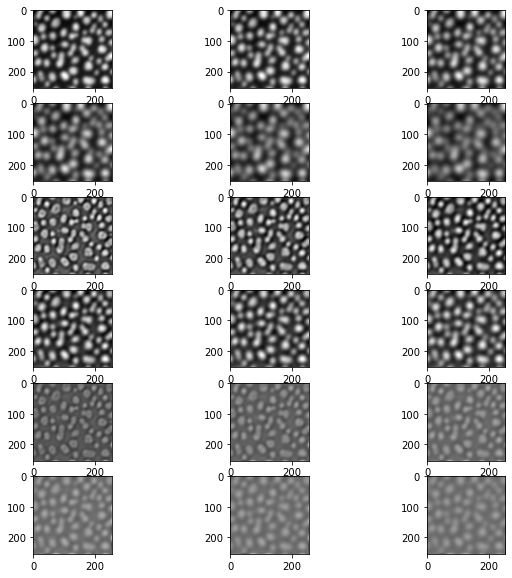
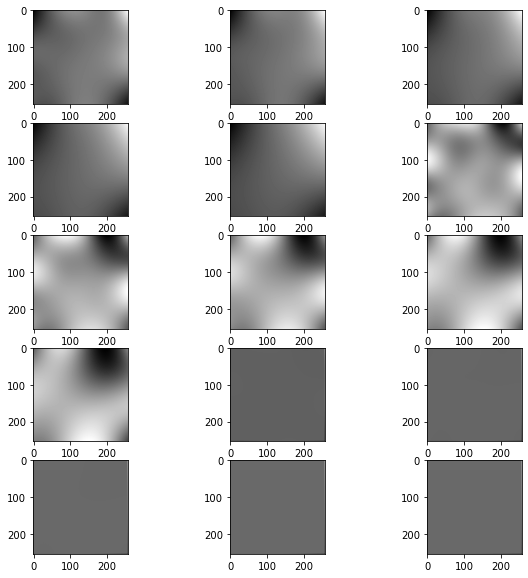
There are also some pre-defined Feature sets:
for f in apoc.PredefinedFeatureSet:
    print(f)
    visualize(apoc.generate_feature_stack(image, f))
PredefinedFeatureSet.custom
PredefinedFeatureSet.small_quick

PredefinedFeatureSet.medium_quick
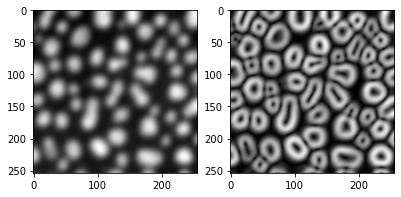
PredefinedFeatureSet.large_quick
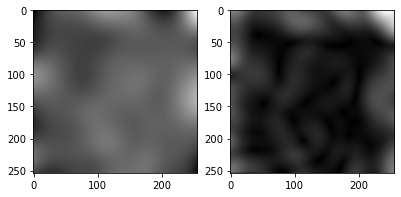
PredefinedFeatureSet.small_dog_log
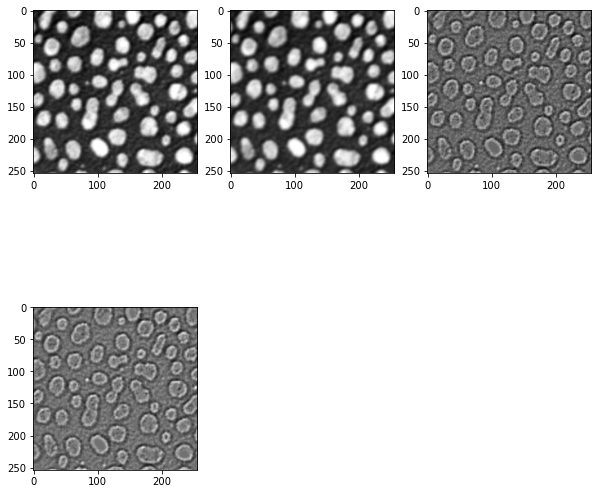
PredefinedFeatureSet.medium_dog_log

PredefinedFeatureSet.large_dog_log

PredefinedFeatureSet.object_size_1_to_2_px
PredefinedFeatureSet.object_size_1_to_5_px
PredefinedFeatureSet.object_size_3_to_8_px
PredefinedFeatureSet.object_size_5_to_10_px
PredefinedFeatureSet.object_size_10_to_15_px
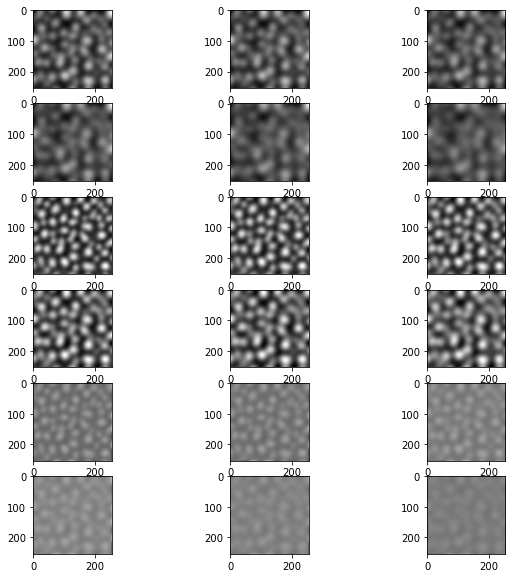
PredefinedFeatureSet.object_size_15_to_20_px
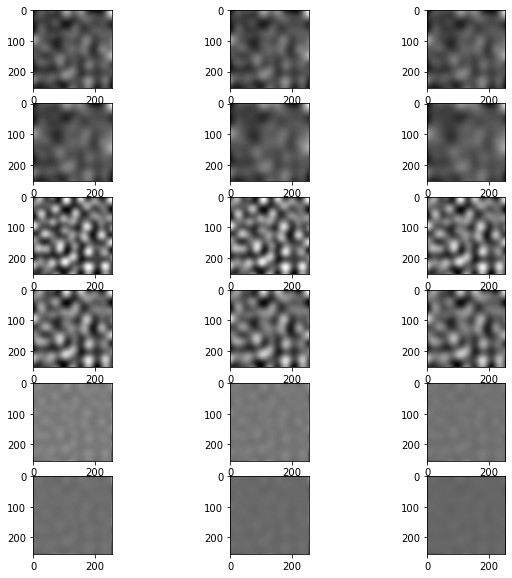
PredefinedFeatureSet.object_size_20_to_25_px
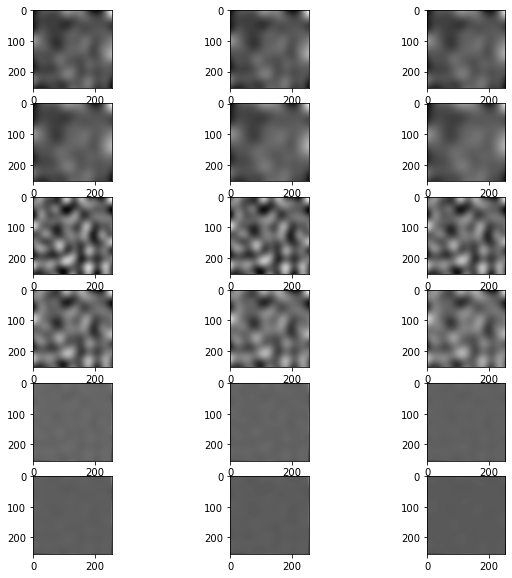
PredefinedFeatureSet.object_size_25_to_50_px
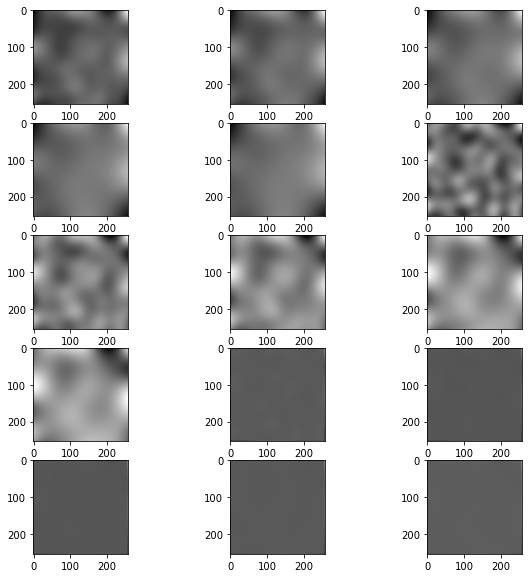
PredefinedFeatureSet.object_size_50_to_100_px
Custom feature definitions#
You can furthermore, define specific features corresponding to clesperanto filters:
feature_stack = apoc.generate_feature_stack(image, "gaussian_blur=3 mean_box=3 top_hat_box=3")

visualize(feature_stack)

feature_stack = apoc.generate_feature_stack(image, "maximum_box=3 difference_of_gaussian=5 sobel=0")

visualize(feature_stack)

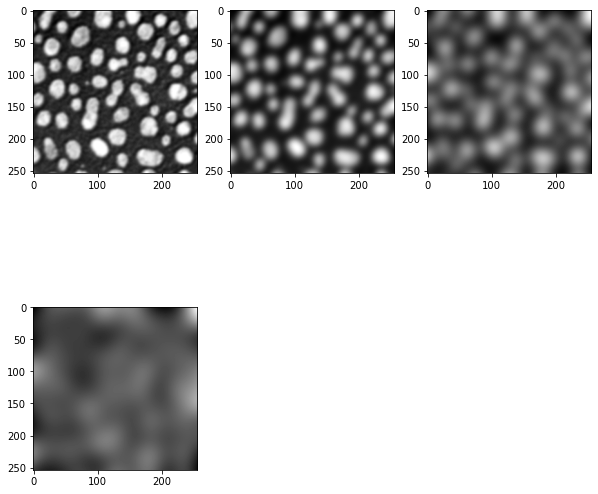
You can also vary radii / sigmas of the fetures:
feature_stack = apoc.generate_feature_stack(image, "gaussian_blur=1 gaussian_blur=5 gaussian_blur=10 gaussian_blur=20")

visualize(feature_stack)
Furthermore, some features can be combined, for example you can compute the sobel of a Gaussian or a Laplacian of a Gaussian
feature_stack = apoc.generate_feature_stack(image, "sobel_of_gaussian_blur=1 sobel_of_gaussian_blur=5 sobel_of_gaussian_blur=10")

visualize(feature_stack)

feature_stack = apoc.generate_feature_stack(image, "laplace_box_of_gaussian_blur=1 laplace_box_of_gaussian_blur=5 laplace_box_of_gaussian_blur=10")

visualize(feature_stack)

