BIA Bob#
BIA Bob is a Jupyter-magic based assistant for interacting with data via code.
from bia_bob import bob
bob.initialize('gpt-4-1106-preview')
bob.__version__
'0.10.2'
You can use the %bob single-line or the %%bob multi-line magic to ask for programming image analysis tasks and bob will generate code for this and paste it in a new cell below. You need to wait until this cell exists before you can execute it. Thus, running an entire notebook in one shot makes little sense. Run it cell-by-cell instead and consider reading generated code before executing it.
%bob Load the ../../data/blobs.tif image file and show it.
I will load an image file named blobs.tif located two directories up in the data folder and display it.
from skimage.io import imread
import stackview

# Load the image
image = imread('../../data/blobs.tif')

# Show the image
stackview.insight(image)

|

|
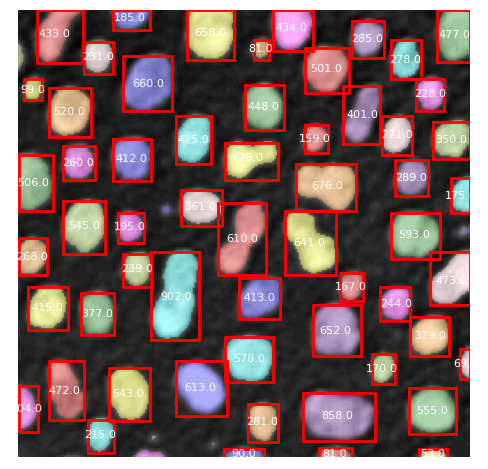
%%bob
Load the ../../data/blobs.tif grayscale image from disc.
Segment the nuclei-like objects in it using
Otsu's method and connected component labeling.
Measure area of the segmented labels.
Print the area on top of the labels.
I will load a grayscale image named blobs.tif, segment the nuclei-like objects using Otsu’s thresholding method and connected component labeling, measure the area of each label, and finally print the area on top of the corresponding labels.
from skimage.io import imread
from skimage.filters import threshold_otsu
from skimage.measure import label, regionprops
from skimage.color import label2rgb
import matplotlib.pyplot as plt
import numpy as np

# Load the image
image = imread('../../data/blobs.tif')

# Apply Otsu's threshold
thresh = threshold_otsu(image)
binary = image > thresh

# Label the image
label_image = label(binary)

# Measure properties of labeled regions
properties = regionprops(label_image)

# Annotate the image with area information
annotated_image = label2rgb(label_image, image=image)

fig, ax = plt.subplots()
ax.imshow(annotated_image)

for region in properties:
    # take regions with large enough areas
    if region.area >= 50:
        # draw rectangle around segmented objects
        minr, minc, maxr, maxc = region.bbox
        rect = plt.Rectangle((minc, minr), maxc - minc, maxr - minr,
                             fill=False, edgecolor='red', linewidth=2)
        ax.add_patch(rect)

        # print area on top of the nuclei-like objects
        ax.text(region.centroid[1], region.centroid[0], f'{region.area}',
                verticalalignment='center', horizontalalignment='center',
                color='white', fontsize=8)

ax.set_axis_off()
plt.tight_layout()
plt.show()
%%bob
Take the segmented label image and expand the labels by 4 pixels. Show the resulting label image alone.
I will take the given segmented label image and expand the labels by 4 pixels, then display the resulting label image.
from skimage.segmentation import expand_labels
import stackview

# Expand the labels by 4 pixels
expanded_labels = expand_labels(label_image, distance=4)

# Show the resulting expanded label image
stackview.insight(expanded_labels)

|
|