Parametric maps#
This notebook demonstrates how parametric maps can be made. In such parametric images, pixel intensity corresponds to measurements of the objects, for example area.
import numpy as np
import pyclesperanto_prototype as cle
from skimage.io import imread, imsave
from skimage.measure import regionprops, regionprops_table
from skimage.util import map_array
from napari_simpleitk_image_processing import label_statistics
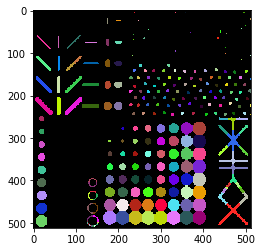
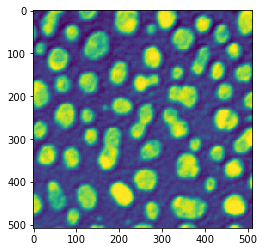
Starting point for drawing parametric maps is always a label image.
binary = cle.artificial_objects_2d()
labels = cle.voronoi_otsu_labeling(binary, spot_sigma=5)

cle.imshow(labels, labels=True)
Parametric maps using scikit-image#
You can also compute your own measurement for each object and then visualize it in a parametric map image. Consider using scikit-image’s regionprops() for computing the measurements.
statistics_table = regionprops_table(cle.pull(labels), properties=('label', 'area',))
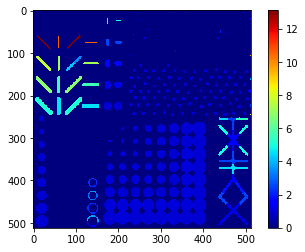
Area map#
remapped = map_array(
cle.pull(labels),
statistics_table['label'],
statistics_table['area'],
)
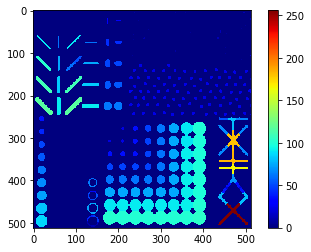
cle.imshow(remapped, colorbar=True, color_map="jet")
Parametric maps in pyclesperanto#
Alternatively, we can use the function cle.replace_intensities for making these parametric maps. It expects a label image and a list of measurements ordered by label, starting with a measurement corresponding to background (index 0). In the list of measurements, no label should be missing. Consider to relabel the label image sequentially if necessary.
statistics = regionprops(cle.pull(labels))
# we're appending a [0] for the "measurement" of the background and attach all values behind
area = [0] + [s.area for s in statistics]

area_map2 = cle.replace_intensities(labels, area)

cle.imshow(area_map2, colorbar=True, color_map="jet")
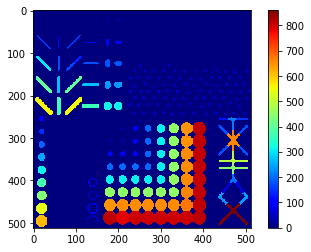
Pixel count map#
pyclesperanto comes with some maps built-in. For example the pixel count map derived from a label image expresses area or volume of objects in colour.
pixel_count_map = cle.label_pixel_count_map(labels)

cle.imshow(pixel_count_map, color_map='jet', colorbar=True)
/Users/haase/code/pyclesperanto_prototype/pyclesperanto_prototype/_tier9/_statistics_of_labelled_pixels.py:283: RuntimeWarning: invalid value encountered in true_divide
  region_props['mean_max_distance_to_centroid_ratio'] = region_props['max_distance_to_centroid'] / region_props[
/Users/haase/code/pyclesperanto_prototype/pyclesperanto_prototype/_tier9/_statistics_of_labelled_pixels.py:285: RuntimeWarning: invalid value encountered in true_divide
  region_props['mean_max_distance_to_mass_center_ratio'] = region_props['max_distance_to_mass_center'] / region_props[
Parametric maps using SimpleITK-based measurements#
Furthermore, also SimpleITK comes with quantitative measurements for labeled images. For convenience reasons, we will use the scriptable napari plugin napari-simpleitk-image-processing for deriving measurements.
statistics_sitk = label_statistics(labels, labels, size=True, shape=True, perimeter=True, intensity=False)

print(statistics_sitk.keys())
dict_keys(['label', 'elongation', 'feret_diameter', 'flatness', 'roundness', 'equivalent_ellipsoid_diameter_0', 'equivalent_ellipsoid_diameter_1', 'equivalent_spherical_perimeter', 'equivalent_spherical_radius', 'number_of_pixels', 'number_of_pixels_on_border', 'perimeter', 'perimeter_on_border', 'perimeter_on_border_ratio'])
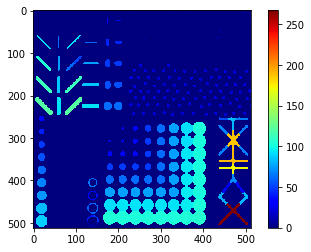
Number of pixels map#
# we're appending a [0] for the "measurement" of the background and attach all values behind
number_of_pixels = [0] + statistics_sitk['number_of_pixels']

number_of_pixels_map = cle.replace_intensities(labels, number_of_pixels)

cle.imshow(number_of_pixels_map, colorbar=True, color_map="jet")
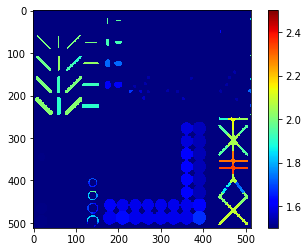
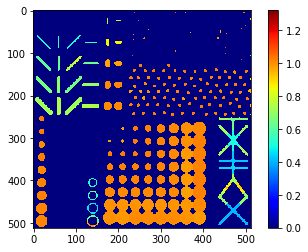
Extension ratio map#
The extension ratio is a shape descriptor derived from the maximum distance of pixels to their object’s centroid divided by the average distance of pixels to the centroid. It alllows to differentiate elongated from roundish objects.
extension_ratio_map = cle.extension_ratio_map(labels)

cle.imshow(extension_ratio_map,
           color_map='jet',
           colorbar=True,
           min_display_intensity=1.5,
           max_display_intensity=2.5)
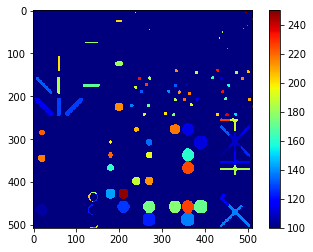
Mean / minimum / maximum / standard-deviation intensity map#
If we use additionally an intensity image, we can also produce parametric images showing intensity measurements.
blobs = cle.scale(imread('../../data/blobs.tif'), factor_x=2, factor_y=2, auto_size=True)

cle.imshow(blobs)
mean_intensity_map = cle.label_mean_intensity_map(blobs, labels)
cle.imshow(mean_intensity_map,
           color_map='jet',
           colorbar=True,
           min_display_intensity=100,
           max_display_intensity=250)
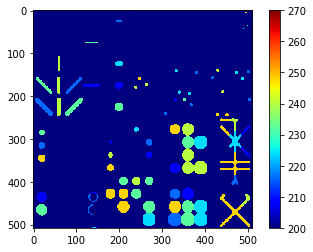
maximum_intensity_map = cle.maximum_intensity_map(blobs, labels)
cle.imshow(maximum_intensity_map,
           color_map='jet',
           colorbar=True,
           min_display_intensity=200,
           max_display_intensity=270)
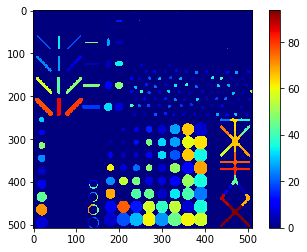
stddev_intensity_map = cle.standard_deviation_intensity_map(blobs, labels)
cle.imshow(stddev_intensity_map, color_map='jet', colorbar=True)
Aspect ratio map#
# we're appending a [0] for the "measurement" of the background and attach all values behind
aspect_ratio = [0]

for s in statistics:
    if s.minor_axis_length:
        aspect_ratio.append(s.major_axis_length / s.minor_axis_length)
    else:
        aspect_ratio.append(0) # note: an aspect ratio of 0 is an "invalid" value
aspect_ratio_map = cle.replace_intensities(labels, aspect_ratio)

cle.imshow(aspect_ratio_map, colorbar=True, color_map="jet")
Elongation map#
# we're appending a [0] for the "measurement" of the background and attach all values behind
eccentricity = [0] + [s.eccentricity for s in statistics]

eccentricity_map = cle.replace_intensities(labels, eccentricity)

cle.imshow(eccentricity_map, colorbar=True, color_map="jet")
Extent map#
# we're appending a [0] for the "measurement" of the background and attach all values behind
extent = [0] + [s.extent for s in statistics]

extent_map = cle.replace_intensities(labels, extent)

cle.imshow(extent_map, colorbar=True, color_map="jet")
Feret diameter map#
# we're appending a [0] for the "measurement" of the background and attach all values behind
feret_diameter = [0] + [s.feret_diameter_max for s in statistics]

feret_diameter_map = cle.replace_intensities(labels, feret_diameter)

cle.imshow(feret_diameter_map, colorbar=True, color_map="jet")
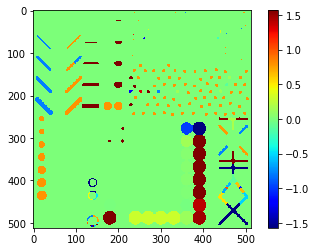
Orientation map#
# we're appending a [0] for the "measurement" of the background and attach all values behind
orientation = [0] + [s.orientation for s in statistics]

orientation_map = cle.replace_intensities(labels, orientation)

cle.imshow(orientation_map, colorbar=True, color_map="jet")
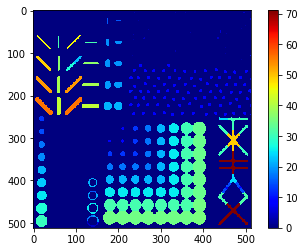
Perimeter map#
# we're appending a [0] for the "measurement" of the background and attach all values behind
perimeter_ski = [0] + [s.perimeter for s in statistics]

perimeter_ski_map = cle.replace_intensities(labels, perimeter_ski)

cle.imshow(perimeter_ski_map, colorbar=True, color_map="jet")
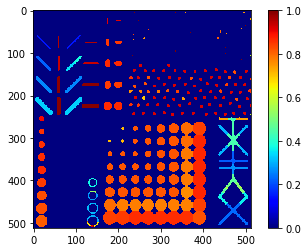
Solidity map#
# we're appending a [0] for the "measurement" of the background and attach all values behind
solidity = [0] + [s.solidity for s in statistics]

solidity_map = cle.replace_intensities(labels, solidity)

cle.imshow(solidity_map, colorbar=True, color_map="jet")
Elongation map#
# we're appending a [0] for the "measurement" of the background and attach all values behind
elongation = [0] + statistics_sitk['elongation']

elongation_map = cle.replace_intensities(labels, elongation)

cle.imshow(elongation_map, colorbar=True, color_map="jet")
Flatness map#
# we're appending a [0] for the "measurement" of the background and attach all values behind
flatness = [0] + statistics_sitk['flatness']

flatness_map = cle.replace_intensities(labels, flatness)

cle.imshow(flatness_map, colorbar=True, color_map="jet")
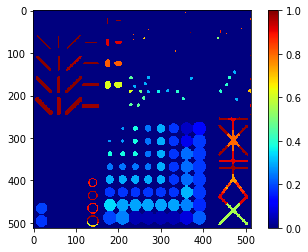
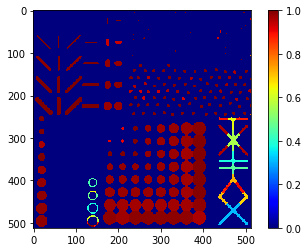
Roundness map#
# we're appending a [0] for the "measurement" of the background and attach all values behind
roundness = [0] + statistics_sitk['roundness']

roundness_map = cle.replace_intensities(labels, roundness)

cle.imshow(roundness_map, colorbar=True, color_map="jet")
Perimeter map#
# we're appending a [0] for the "measurement" of the background and attach all values behind
perimeter_sitk = [0] + statistics_sitk['perimeter']

perimeter_sitk_map = cle.replace_intensities(labels, perimeter_sitk)

cle.imshow(perimeter_sitk_map, colorbar=True, color_map="jet")
Quality assurance#
If you generate a parametric image with the “label” column, the parametric image should actually be equal to the label input image.
# we're appending a [0] for the "measurement" of the background and attach all values behind
label = [0] + statistics_sitk['label']

label_map = cle.replace_intensities(labels, label)

cle.imshow(label_map, labels=True)
label_difference = labels - label_map

cle.imshow(label_difference)
label_difference.min(), label_difference.max()
(0.0, 0.0)
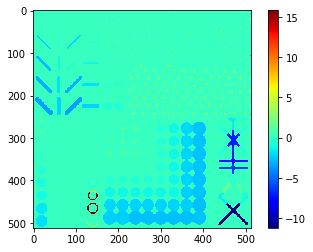
When comparing perimeter measurements from scikit-image and SimpleITK, we could see small differences. Here we can visualize which objects are affected and to what degree.
perimeter_difference = perimeter_sitk_map - perimeter_ski_map

cle.imshow(perimeter_difference, colorbar=True, color_map="jet")