Statistics of neighbors#
When characterizing tissues, it may be useful to summarize statistics such as the average distance labels to their neighbors.
Note: When measuring distances, the centroid-to-centroid distance is called distance for simplicity unless mentioned otherwise. Furthermore, keep in mind that most of the shown measurements only work correctly when using label images with isotropic pixels / voxels.
import numpy as np
import pyclesperanto_prototype as cle
from skimage.io import imread
import matplotlib.pyplot as plt
import pandas as pd
We use this example label image to show what the different measurements mean. In the following, most measures will be explained for the object number 7 in the center of the image.
labels = cle.scale(cle.asarray([
   [1, 1, 2, 2, 3, 3, 3, 3],
   [1, 1, 2, 2, 3, 3, 3, 3],
   [1, 1, 7, 7, 7, 7, 3, 3],
   [1, 1, 7, 7, 7, 7, 3, 3],
   [6, 6, 7, 7, 7, 7, 4, 4],
   [6, 6, 7, 7, 7, 7, 4, 4],
   [5, 5, 5, 5, 5, 5, 4, 4],
   [5, 5, 5, 5, 5, 5, 4, 4],
]), factor_x=10, factor_y=10, auto_size=True).astype(np.uint32)

labels

|
cle._ image
|
Distance meshes#
Before diving into details we should first have a look at neighborhood relationships and distances between neighbors. A distance mesh visualizes the distances between centroids in colour.
distance_mesh = cle.draw_distance_mesh_between_touching_labels(labels)
cle.imshow(distance_mesh, colorbar=True, colormap="rainbow")
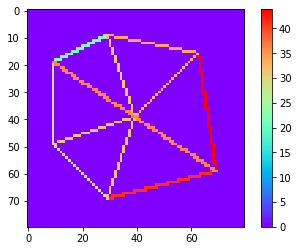
Simple statistics such as the longest distance between direct neighbors can be measured from that image.
distance_mesh.max()
43.843155
For more detailed statistics we use a table / pandas DataFrame.
stats = pd.DataFrame(cle.statistics_of_labelled_neighbors(labels))
stats
| label | touching_neighbor_count | minimum_distance_of_touching_neighbors | average_distance_of_touching_neighbors | maximum_distance_of_touching_neighbors | max_min_distance_ratio_of_touching_neighbors | proximal_neighbor_count_d10 | proximal_neighbor_count_d20 | proximal_neighbor_count_d40 | proximal_neighbor_count_d80 | ... | touch_portion_above_0.2_neighbor_count | touch_portion_above_0.33_neighbor_count | touch_portion_above_0.5_neighbor_count | touch_portion_above_0.75_neighbor_count | touch_count_sum | minimum_touch_count | maximum_touch_count | minimum_touch_portion | maximum_touch_portion | standard_deviation_touch_portion | |
|---|---|---|---|---|---|---|---|---|---|---|---|---|---|---|---|---|---|---|---|---|---|
| 0 | 1 | 3.0 | 22.360680 | 29.472065 | 36.055511 | 1.612452 | 0.0 | 0.0 | 3.0 | 6.0 | ... | 3.0 | 3.0 | 0.0 | 0.0 | 60.0 | 20.0 | 20.0 | 0.333333 | 0.333333 | 2.980232e-08 |
| 1 | 2 | 3.0 | 22.360680 | 29.325642 | 33.993465 | 1.520234 | 0.0 | 0.0 | 3.0 | 6.0 | ... | 3.0 | 3.0 | 0.0 | 0.0 | 60.0 | 20.0 | 20.0 | 0.333333 | 0.333333 | 2.980232e-08 |
| 2 | 3 | 3.0 | 32.998318 | 36.944984 | 43.843155 | 1.328648 | 0.0 | 0.0 | 2.0 | 6.0 | ... | 3.0 | 2.0 | 0.0 | 0.0 | 80.0 | 20.0 | 40.0 | 0.250000 | 0.500000 | 1.111111e-01 |
| 3 | 4 | 3.0 | 36.055511 | 40.376575 | 43.843155 | 1.215990 | 0.0 | 0.0 | 1.0 | 6.0 | ... | 3.0 | 2.0 | 0.0 | 0.0 | 60.0 | 20.0 | 20.0 | 0.333333 | 0.333333 | 2.980232e-08 |
| 4 | 5 | 3.0 | 28.284273 | 33.712704 | 41.231056 | 1.457738 | 0.0 | 0.0 | 2.0 | 6.0 | ... | 3.0 | 2.0 | 0.0 | 0.0 | 80.0 | 20.0 | 40.0 | 0.250000 | 0.500000 | 1.111111e-01 |
| 5 | 6 | 3.0 | 28.284273 | 29.969015 | 31.622776 | 1.118034 | 0.0 | 0.0 | 3.0 | 6.0 | ... | 3.0 | 2.0 | 0.0 | 0.0 | 60.0 | 20.0 | 20.0 | 0.333333 | 0.333333 | 2.980232e-08 |
| 6 | 7 | 6.0 | 31.622776 | 33.329613 | 36.055511 | 1.140175 | 0.0 | 0.0 | 6.0 | 6.0 | ... | 6.0 | 6.0 | 0.0 | 0.0 | 160.0 | 20.0 | 40.0 | 0.125000 | 0.250000 | 5.555556e-02 |
7 rows × 44 columns
This table contains these columns:
stats.describe().T
| count | mean | std | min | 25% | 50% | 75% | max | |
|---|---|---|---|---|---|---|---|---|
| label | 7.0 | 4.000000 | 2.160247 | 1.000000e+00 | 2.500000e+00 | 4.000000e+00 | 5.500000 | 7.000000 |
| touching_neighbor_count | 7.0 | 3.428571 | 1.133893 | 3.000000e+00 | 3.000000e+00 | 3.000000e+00 | 3.000000 | 6.000000 |
| minimum_distance_of_touching_neighbors | 7.0 | 28.852358 | 5.190999 | 2.236068e+01 | 2.532248e+01 | 2.828427e+01 | 32.310547 | 36.055511 |
| average_distance_of_touching_neighbors | 7.0 | 33.304371 | 4.184873 | 2.932564e+01 | 2.972054e+01 | 3.332961e+01 | 35.328844 | 40.376575 |
| maximum_distance_of_touching_neighbors | 7.0 | 38.092091 | 4.881063 | 3.162278e+01 | 3.502449e+01 | 3.605551e+01 | 42.537106 | 43.843155 |
| max_min_distance_ratio_of_touching_neighbors | 7.0 | 1.341896 | 0.193760 | 1.118034e+00 | 1.178083e+00 | 1.328648e+00 | 1.488986 | 1.612452 |
| proximal_neighbor_count_d10 | 7.0 | 0.000000 | 0.000000 | 0.000000e+00 | 0.000000e+00 | 0.000000e+00 | 0.000000 | 0.000000 |
| proximal_neighbor_count_d20 | 7.0 | 0.000000 | 0.000000 | 0.000000e+00 | 0.000000e+00 | 0.000000e+00 | 0.000000 | 0.000000 |
| proximal_neighbor_count_d40 | 7.0 | 2.857143 | 1.573592 | 1.000000e+00 | 2.000000e+00 | 3.000000e+00 | 3.000000 | 6.000000 |
| proximal_neighbor_count_d80 | 7.0 | 6.000000 | 0.000000 | 6.000000e+00 | 6.000000e+00 | 6.000000e+00 | 6.000000 | 6.000000 |
| proximal_neighbor_count_d160 | 7.0 | 6.000000 | 0.000000 | 6.000000e+00 | 6.000000e+00 | 6.000000e+00 | 6.000000 | 6.000000 |
| maximum_distance_of_n1_nearest_neighbors | 7.0 | 28.852358 | 5.191000 | 2.236068e+01 | 2.532248e+01 | 2.828427e+01 | 32.310547 | 36.055511 |
| average_distance_of_n1_nearest_neighbors | 7.0 | 28.852358 | 5.191000 | 2.236068e+01 | 2.532248e+01 | 2.828427e+01 | 32.310547 | 36.055511 |
| maximum_distance_of_n2_nearest_neighbors | 7.0 | 32.870403 | 3.922370 | 3.000000e+01 | 3.081139e+01 | 3.162278e+01 | 32.808121 | 41.231056 |
| average_distance_of_n2_nearest_neighbors | 7.0 | 30.861380 | 4.257244 | 2.618034e+01 | 2.806693e+01 | 2.995353e+01 | 32.559334 | 38.643284 |
| maximum_distance_of_n3_nearest_neighbors | 7.0 | 37.458839 | 5.444354 | 3.162278e+01 | 3.280812e+01 | 3.605551e+01 | 42.537104 | 43.843155 |
| average_distance_of_n3_nearest_neighbors | 7.0 | 33.060535 | 4.232608 | 2.932564e+01 | 2.972054e+01 | 3.162278e+01 | 35.328842 | 40.376572 |
| maximum_distance_of_n4_nearest_neighbors | 7.0 | 49.142155 | 9.086052 | 3.299832e+01 | 4.472136e+01 | 5.343740e+01 | 53.644524 | 60.827621 |
| average_distance_of_n4_nearest_neighbors | 7.0 | 37.080940 | 4.918169 | 3.196666e+01 | 3.341583e+01 | 3.546340e+01 | 39.907761 | 45.489334 |
| maximum_distance_of_n5_nearest_neighbors | 7.0 | 56.808464 | 9.705204 | 3.605551e+01 | 5.692582e+01 | 6.000000e+01 | 61.860416 | 64.031242 |
| average_distance_of_n5_nearest_neighbors | 7.0 | 41.026447 | 5.346182 | 3.278444e+01 | 3.881543e+01 | 3.914105e+01 | 44.215530 | 49.197720 |
| maximum_distance_of_n6_nearest_neighbors | 7.0 | 61.855495 | 12.137788 | 3.605551e+01 | 6.289321e+01 | 6.289321e+01 | 68.071133 | 72.111023 |
| average_distance_of_n6_nearest_neighbors | 7.0 | 44.497955 | 6.060761 | 3.332961e+01 | 4.292323e+01 | 4.463604e+01 | 47.328476 | 53.016602 |
| maximum_distance_of_n7_nearest_neighbors | 7.0 | 61.855495 | 12.137788 | 3.605551e+01 | 6.289321e+01 | 6.289321e+01 | 68.071133 | 72.111023 |
| average_distance_of_n7_nearest_neighbors | 7.0 | 48.585533 | 5.194938 | 3.901267e+01 | 4.723577e+01 | 4.870390e+01 | 51.011694 | 55.887230 |
| maximum_distance_of_n8_nearest_neighbors | 7.0 | 61.855495 | 12.137788 | 3.605551e+01 | 6.289321e+01 | 6.289321e+01 | 68.071133 | 72.111023 |
| average_distance_of_n8_nearest_neighbors | 7.0 | 48.585533 | 5.194938 | 3.901267e+01 | 4.723577e+01 | 4.870390e+01 | 51.011694 | 55.887230 |
| maximum_distance_of_n10_nearest_neighbors | 7.0 | 61.855495 | 12.137788 | 3.605551e+01 | 6.289321e+01 | 6.289321e+01 | 68.071133 | 72.111023 |
| average_distance_of_n10_nearest_neighbors | 7.0 | 48.585533 | 5.194938 | 3.901267e+01 | 4.723577e+01 | 4.870390e+01 | 51.011694 | 55.887230 |
| maximum_distance_of_n20_nearest_neighbors | 7.0 | 61.855495 | 12.137788 | 3.605551e+01 | 6.289321e+01 | 6.289321e+01 | 68.071133 | 72.111023 |
| average_distance_of_n20_nearest_neighbors | 7.0 | 48.585533 | 5.194938 | 3.901267e+01 | 4.723577e+01 | 4.870390e+01 | 51.011694 | 55.887230 |
| distance_to_most_distant_other | 7.0 | 61.855495 | 12.137788 | 3.605551e+01 | 6.289321e+01 | 6.289321e+01 | 68.071133 | 72.111023 |
| touch_portion_above_0_neighbor_count | 7.0 | 3.428571 | 1.133893 | 3.000000e+00 | 3.000000e+00 | 3.000000e+00 | 3.000000 | 6.000000 |
| touch_portion_above_0.16_neighbor_count | 7.0 | 3.428571 | 1.133893 | 3.000000e+00 | 3.000000e+00 | 3.000000e+00 | 3.000000 | 6.000000 |
| touch_portion_above_0.2_neighbor_count | 7.0 | 3.428571 | 1.133893 | 3.000000e+00 | 3.000000e+00 | 3.000000e+00 | 3.000000 | 6.000000 |
| touch_portion_above_0.33_neighbor_count | 7.0 | 2.857143 | 1.463850 | 2.000000e+00 | 2.000000e+00 | 2.000000e+00 | 3.000000 | 6.000000 |
| touch_portion_above_0.5_neighbor_count | 7.0 | 0.000000 | 0.000000 | 0.000000e+00 | 0.000000e+00 | 0.000000e+00 | 0.000000 | 0.000000 |
| touch_portion_above_0.75_neighbor_count | 7.0 | 0.000000 | 0.000000 | 0.000000e+00 | 0.000000e+00 | 0.000000e+00 | 0.000000 | 0.000000 |
| touch_count_sum | 7.0 | 80.000000 | 36.514839 | 6.000000e+01 | 6.000000e+01 | 6.000000e+01 | 80.000000 | 160.000000 |
| minimum_touch_count | 7.0 | 20.000000 | 0.000000 | 2.000000e+01 | 2.000000e+01 | 2.000000e+01 | 20.000000 | 20.000000 |
| maximum_touch_count | 7.0 | 28.571428 | 10.690450 | 2.000000e+01 | 2.000000e+01 | 2.000000e+01 | 40.000000 | 40.000000 |
| minimum_touch_portion | 7.0 | 0.279762 | 0.078743 | 1.250000e-01 | 2.500000e-01 | 3.333333e-01 | 0.333333 | 0.333333 |
| maximum_touch_portion | 7.0 | 0.369048 | 0.094491 | 2.500000e-01 | 3.333333e-01 | 3.333333e-01 | 0.416667 | 0.500000 |
| standard_deviation_touch_portion | 7.0 | 0.039683 | 0.052844 | 2.980232e-08 | 2.980232e-08 | 2.980232e-08 | 0.083333 | 0.111111 |
The following code snippets show how we can interpret that table. All examples refer to the labeled object 7 in the center of the label image shown above.
print("The label of the last object is",
      stats["label"].tolist()[-1])
The label of the last object is 7
print("The last object has",
      stats["touching_neighbor_count"].tolist()[-1],
     "touching neighbors")
The last object has 6.0 touching neighbors
print("The maximum distance of any label centroid to any other is",
      stats["maximum_distance_of_touching_neighbors"].max())
The maximum distance of any label centroid to any other is 43.843155
print("The last object has an average distance to its touching neighbors of",
     stats["average_distance_of_touching_neighbors"].tolist()[-1]
     )
The last object has an average distance to its touching neighbors of 33.329612731933594
print("The last object has an minimum distance to its touching neighbors of",
     stats["minimum_distance_of_touching_neighbors"].tolist()[-1]
     )
The last object has an minimum distance to its touching neighbors of 31.62277603149414
print("The last object has an maximum distance to its touching neighbors of",
     stats["maximum_distance_of_touching_neighbors"].tolist()[-1]
     )
The last object has an maximum distance to its touching neighbors of 36.055511474609375
for d in [10, 20, 40, 80]:
    print("There are",
          stats["proximal_neighbor_count_d" + str(d)].tolist()[-1],
          "objects around the last labeled object within a radius of",
          d,
          "pixels"
         )
There are 0.0 objects around the last labeled object within a radius of 10 pixels
There are 0.0 objects around the last labeled object within a radius of 20 pixels
There are 6.0 objects around the last labeled object within a radius of 40 pixels
There are 6.0 objects around the last labeled object within a radius of 80 pixels
for n in [1,2,3,4,5,6]:
    print("The " + str(n) + ". neighbor of the last label is",
          stats["maximum_distance_of_n" + str(n) + "_nearest_neighbors"].tolist()[-1],
          "pixels away."
    )
The 1. neighbor of the last label is 31.62277603149414 pixels away.
The 2. neighbor of the last label is 31.62277603149414 pixels away.
The 3. neighbor of the last label is 31.62277603149414 pixels away.
The 4. neighbor of the last label is 32.99831771850586 pixels away.
The 5. neighbor of the last label is 36.055511474609375 pixels away.
The 6. neighbor of the last label is 36.055511474609375 pixels away.
for n in [1,2,3,4,5,6]:
    print("The average distance to the " + str(n) + " neighbors of the last label is",
          stats["average_distance_of_n" + str(n) + "_nearest_neighbors"].tolist()[-1],
          "pixels."
    )
The average distance to the 1 neighbors of the last label is 31.62277603149414 pixels.
The average distance to the 2 neighbors of the last label is 31.62277603149414 pixels.
The average distance to the 3 neighbors of the last label is 31.622777938842773 pixels.
The average distance to the 4 neighbors of the last label is 31.966663360595703 pixels.
The average distance to the 5 neighbors of the last label is 32.7844352722168 pixels.
The average distance to the 6 neighbors of the last label is 33.329612731933594 pixels.
Tocuh count and touch portion#
Just for reader’s convenience we visualize the label image again.
labels
|
|
cle._ image
|
print("The last labelled object has",
      stats["touch_count_sum"].tolist()[-1],
      "pixels where it touches others")
The last labelled object has 160.0 pixels where it touches others
print("The last labelled object touches an other object with at least",
      stats["minimum_touch_count"].tolist()[-1],
      "pixels")
The last labelled object touches an other object with at least 20.0 pixels
print("The last labelled object touches an other object with up to",
      stats["maximum_touch_count"].tolist()[-1],
      "pixels")
The last labelled object touches an other object with up to 40.0 pixels
print("The last labelled object touches an other object with at least",
      stats["minimum_touch_portion"].tolist()[-1] * 100,
      "percent of its border")
The last labelled object touches an other object with at least 12.5 percent of its border
print("The last labelled object touches an other object with up to",
      stats["maximum_touch_portion"].tolist()[-1] * 100,
      "percent of its border")
The last labelled object touches an other object with up to 25.0 percent of its border
Visualization of statistics#
We can visualize those measurements in parametric map images.
For visualization of the table columns as maps, we typically need to prefix the measurements with a 0. This 0 represents the measurement of the background.
stats["touching_neighbor_count"].tolist()
[3.0, 3.0, 3.0, 3.0, 3.0, 3.0, 6.0]
list_of_measurements = cle.prefix_in_x([stats["touching_neighbor_count"].tolist()])
list_of_measurements
cle.array([[0. 3. 3. 3. 3. 3. 3. 6.]], dtype=float32)
cle.replace_intensities(labels, list_of_measurements)

|
cle._ image

|
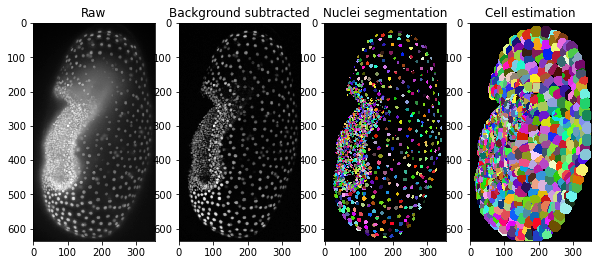
As more realistic example, we visualize the measurements in an image stack of a Tribolium embryo. The dataset, curtesy of Daniela Vorkel / Myers lab / MPI-CBG / CSBD can be downloaded here.
embryo = imread("../../../clesperanto_example_data/Lund-100MB.tif")[3]

bg_subtracted = cle.top_hat_box(embryo, radius_x=5, radius_y=5)

nuclei_labels = cle.voronoi_otsu_labeling(bg_subtracted, spot_sigma=0.5, outline_sigma=1)

cell_estimation = cle.dilate_labels(nuclei_labels, radius=12)
fig, axs = plt.subplots(1, 4, figsize=(10,10))

axs[0].set_title("Raw")
cle.imshow(embryo, plot=axs[0])
axs[1].set_title("Background subtracted")
cle.imshow(bg_subtracted, plot=axs[1])
axs[2].set_title("Nuclei segmentation")
cle.imshow(nuclei_labels, plot=axs[2], labels=True)
axs[3].set_title("Cell estimation")
cle.imshow(cell_estimation, plot=axs[3], labels=True)
tribolium_statistics = pd.DataFrame(cle.statistics_of_labelled_neighbors(cell_estimation))
tribolium_statistics.head()
| label | touching_neighbor_count | minimum_distance_of_touching_neighbors | average_distance_of_touching_neighbors | maximum_distance_of_touching_neighbors | proximal_neighbor_count_d10 | proximal_neighbor_count_d20 | proximal_neighbor_count_d40 | proximal_neighbor_count_d80 | proximal_neighbor_count_d160 | ... | average_distance_of_n10_nearest_neighbors | maximum_distance_of_n20_nearest_neighbors | average_distance_of_n20_nearest_neighbors | distance_to_most_distant_other | touch_count_sum | minimum_touch_count | maximum_touch_count | minimum_touch_portion | maximum_touch_portion | standard_deviation_touch_portion | |
|---|---|---|---|---|---|---|---|---|---|---|---|---|---|---|---|---|---|---|---|---|---|
| 0 | 1 | 11.0 | 10.348568 | 15.763863 | 25.492878 | 0.0 | 9.0 | 42.0 | 195.0 | 665.0 | ... | 15.164477 | 27.046114 | 20.066113 | 482.901642 | 1586.0 | 12.0 | 373.0 | 0.007566 | 0.235183 | 0.065240 |
| 1 | 2 | 4.0 | 9.680110 | 11.968576 | 15.206567 | 1.0 | 5.0 | 26.0 | 149.0 | 568.0 | ... | 19.315979 | 35.638351 | 25.482178 | 505.435364 | 1077.0 | 38.0 | 486.0 | 0.035283 | 0.451253 | 0.117224 |
| 2 | 3 | 7.0 | 7.612343 | 13.007790 | 15.458411 | 1.0 | 7.0 | 44.0 | 201.0 | 690.0 | ... | 16.436604 | 28.811810 | 21.466221 | 473.300323 | 632.0 | 4.0 | 308.0 | 0.006329 | 0.487342 | 0.100555 |
| 3 | 4 | 4.0 | 9.382964 | 11.711300 | 13.744253 | 1.0 | 9.0 | 39.0 | 190.0 | 648.0 | ... | 15.705339 | 28.550455 | 20.369110 | 486.618164 | 584.0 | 48.0 | 214.0 | 0.082192 | 0.366438 | 0.085616 |
| 4 | 5 | 8.0 | 9.382964 | 13.527851 | 17.916573 | 1.0 | 8.0 | 37.0 | 180.0 | 620.0 | ... | 15.669672 | 29.883175 | 21.231649 | 494.449829 | 1499.0 | 15.0 | 420.0 | 0.010007 | 0.280187 | 0.067357 |
5 rows × 37 columns
def visualize(label_image, statistics, column):
    list_of_measurements = cle.prefix_in_x([statistics[column].tolist()])

    return cle.replace_intensities(label_image, list_of_measurements)
visualize(cell_estimation, tribolium_statistics, "label")

|
cle._ image

|
Number of touching neighbors and proximal neighbors#
visualize(cell_estimation, tribolium_statistics, "touching_neighbor_count")

|
cle._ image

|
visualize(cell_estimation, tribolium_statistics, "proximal_neighbor_count_d10")

|
cle._ image

|
visualize(cell_estimation, tribolium_statistics, "proximal_neighbor_count_d20")

|
cle._ image

|
visualize(cell_estimation, tribolium_statistics, "proximal_neighbor_count_d40")

|
cle._ image

|
Distances to touching neighbors#
visualize(cell_estimation, tribolium_statistics, "minimum_distance_of_touching_neighbors")

|
cle._ image

|
visualize(cell_estimation, tribolium_statistics, "average_distance_of_touching_neighbors")

|
cle._ image

|
visualize(cell_estimation, tribolium_statistics, "maximum_distance_of_touching_neighbors")

|
cle._ image

|
Distance to nearest neighbors#
visualize(cell_estimation, tribolium_statistics, "maximum_distance_of_n1_nearest_neighbors")
|
|
cle._ image
|
visualize(cell_estimation, tribolium_statistics, "maximum_distance_of_n6_nearest_neighbors")

|
cle._ image

|
visualize(cell_estimation, tribolium_statistics, "maximum_distance_of_n10_nearest_neighbors")

|
cle._ image

|
Distance to the most distant other label#
visualize(cell_estimation, tribolium_statistics, "distance_to_most_distant_other")

|
cle._ image

|
Touch count#
Touch count is the number of voxels labels touch others.
visualize(cell_estimation, tribolium_statistics, "touch_count_sum")

|
cle._ image

|
visualize(cell_estimation, tribolium_statistics, "minimum_touch_count")

|
cle._ image

|
visualize(cell_estimation, tribolium_statistics, "maximum_touch_count")

|
cle._ image

|
Touch portion#
Touch portion is the relative amount of pixels where objects touch one other object divided by the number of all pixels where the object touches others.
visualize(cell_estimation, tribolium_statistics, "minimum_touch_portion")

|
cle._ image

|
visualize(cell_estimation, tribolium_statistics, "maximum_touch_portion")

|
cle._ image

|
visualize(cell_estimation, tribolium_statistics, "standard_deviation_touch_portion")

|
cle._ image

|