Basic statistics with pyclesperanto#
A common use case for image processing in the biology context is deriving statistics of segmented objects. clEsperanto offers a function for that: statistics_of_labelled_pixels.
import pyclesperanto_prototype as cle

import pandas as pd
from skimage.io import imread, imsave, imshow
import matplotlib
import numpy as np

# initialize GPU
cle.select_device("RTX")
<Apple M1 Max on Platform: Apple (2 refs)>
# load data
image = imread('../../data/blobs.tif')
# segment the image
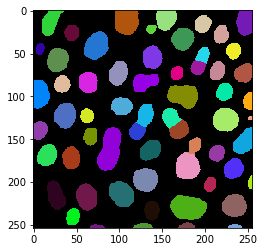
labels = cle.voronoi_otsu_labeling(image, spot_sigma=3.5)
cle.imshow(labels, labels=True)
Deriving basic statistics of labelled objects#
statistics = cle.statistics_of_labelled_pixels(image, labels)
statistics.keys()
dict_keys(['label', 'original_label', 'bbox_min_x', 'bbox_min_y', 'bbox_min_z', 'bbox_max_x', 'bbox_max_y', 'bbox_max_z', 'bbox_width', 'bbox_height', 'bbox_depth', 'min_intensity', 'max_intensity', 'sum_intensity', 'area', 'mean_intensity', 'sum_intensity_times_x', 'mass_center_x', 'sum_intensity_times_y', 'mass_center_y', 'sum_intensity_times_z', 'mass_center_z', 'sum_x', 'centroid_x', 'sum_y', 'centroid_y', 'sum_z', 'centroid_z', 'sum_distance_to_centroid', 'mean_distance_to_centroid', 'sum_distance_to_mass_center', 'mean_distance_to_mass_center', 'standard_deviation_intensity', 'max_distance_to_centroid', 'max_distance_to_mass_center', 'mean_max_distance_to_centroid_ratio', 'mean_max_distance_to_mass_center_ratio'])
We can use pandas to process that kind of tabular data.
table = pd.DataFrame(statistics)
table
| label | original_label | bbox_min_x | bbox_min_y | bbox_min_z | bbox_max_x | bbox_max_y | bbox_max_z | bbox_width | bbox_height | ... | centroid_z | sum_distance_to_centroid | mean_distance_to_centroid | sum_distance_to_mass_center | mean_distance_to_mass_center | standard_deviation_intensity | max_distance_to_centroid | max_distance_to_mass_center | mean_max_distance_to_centroid_ratio | mean_max_distance_to_mass_center_ratio | |
|---|---|---|---|---|---|---|---|---|---|---|---|---|---|---|---|---|---|---|---|---|---|
| 0 | 1 | 1 | 0.0 | 81.0 | 0.0 | 19.0 | 114.0 | 0.0 | 20.0 | 34.0 | ... | 0.0 | 5287.089844 | 9.475071 | 5299.439941 | 9.497204 | 37.766109 | 17.577013 | 17.626616 | 1.855080 | 1.855979 |
| 1 | 2 | 2 | 0.0 | 129.0 | 0.0 | 16.0 | 150.0 | 0.0 | 17.0 | 22.0 | ... | 0.0 | 2064.469482 | 6.702823 | 2064.989746 | 6.704512 | 37.528027 | 11.395502 | 11.287270 | 1.700105 | 1.683533 |
| 2 | 3 | 3 | 3.0 | 39.0 | 0.0 | 13.0 | 51.0 | 0.0 | 11.0 | 13.0 | ... | 0.0 | 463.362244 | 4.064581 | 463.446014 | 4.065316 | 26.381859 | 6.690430 | 6.719399 | 1.646032 | 1.652860 |
| 3 | 4 | 4 | 5.0 | 156.0 | 0.0 | 27.0 | 181.0 | 0.0 | 23.0 | 26.0 | ... | 0.0 | 3969.405273 | 8.304195 | 3969.532715 | 8.304461 | 43.438278 | 13.714880 | 13.820534 | 1.651560 | 1.664230 |
| 4 | 5 | 5 | 10.0 | 0.0 | 0.0 | 35.0 | 29.0 | 0.0 | 26.0 | 30.0 | ... | 0.0 | 4421.953613 | 9.136268 | 4421.724121 | 9.135794 | 37.722134 | 20.016039 | 19.977444 | 2.190833 | 2.186722 |
| ... | ... | ... | ... | ... | ... | ... | ... | ... | ... | ... | ... | ... | ... | ... | ... | ... | ... | ... | ... | ... | ... |
| 56 | 57 | 57 | 236.0 | 0.0 | 0.0 | 255.0 | 29.0 | 0.0 | 20.0 | 30.0 | ... | 0.0 | 4585.168457 | 8.903239 | 4598.605957 | 8.929332 | 40.097881 | 16.315195 | 15.981338 | 1.832501 | 1.789757 |
| 57 | 58 | 58 | 244.0 | 94.0 | 0.0 | 255.0 | 115.0 | 0.0 | 12.0 | 22.0 | ... | 0.0 | 1184.635986 | 5.807039 | 1188.550781 | 5.826229 | 40.151653 | 12.327801 | 12.012736 | 2.122906 | 2.061837 |
| 58 | 59 | 59 | 250.0 | 123.0 | 0.0 | 255.0 | 127.0 | 0.0 | 6.0 | 5.0 | ... | 0.0 | 53.630829 | 1.986327 | 53.704212 | 1.989045 | 18.981472 | 3.287124 | 3.216963 | 1.654876 | 1.617341 |
| 59 | 60 | 60 | 233.0 | 136.0 | 0.0 | 255.0 | 167.0 | 0.0 | 23.0 | 32.0 | ... | 0.0 | 4798.240234 | 9.174456 | 4810.059082 | 9.197054 | 41.817959 | 19.726730 | 19.146832 | 2.150180 | 2.081844 |
| 60 | 61 | 61 | 250.0 | 192.0 | 0.0 | 255.0 | 209.0 | 0.0 | 6.0 | 18.0 | ... | 0.0 | 359.631714 | 4.230961 | 360.904083 | 4.245930 | 43.186157 | 8.888371 | 8.803941 | 2.100792 | 2.073501 |
61 rows × 37 columns
table.describe()
| label | original_label | bbox_min_x | bbox_min_y | bbox_min_z | bbox_max_x | bbox_max_y | bbox_max_z | bbox_width | bbox_height | ... | centroid_z | sum_distance_to_centroid | mean_distance_to_centroid | sum_distance_to_mass_center | mean_distance_to_mass_center | standard_deviation_intensity | max_distance_to_centroid | max_distance_to_mass_center | mean_max_distance_to_centroid_ratio | mean_max_distance_to_mass_center_ratio | |
|---|---|---|---|---|---|---|---|---|---|---|---|---|---|---|---|---|---|---|---|---|---|
| count | 61.000000 | 61.000000 | 61.000000 | 61.000000 | 61.0 | 61.000000 | 61.000000 | 61.0 | 61.000000 | 61.000000 | ... | 61.0 | 61.000000 | 61.000000 | 61.000000 | 61.000000 | 61.000000 | 61.000000 | 61.000000 | 61.000000 | 61.000000 |
| mean | 31.000000 | 31.000000 | 128.245895 | 113.409836 | 0.0 | 148.836060 | 135.672134 | 0.0 | 21.590164 | 23.262295 | ... | 0.0 | 3504.359375 | 7.510857 | 3505.712891 | 7.514835 | 38.998928 | 13.153982 | 13.143246 | 1.757816 | 1.754179 |
| std | 17.752934 | 17.752934 | 77.687981 | 74.343658 | 0.0 | 76.843819 | 73.211273 | 0.0 | 6.502248 | 8.152508 | ... | 0.0 | 2726.386963 | 2.190415 | 2726.795654 | 2.189549 | 6.226861 | 4.019384 | 4.042030 | 0.184103 | 0.177547 |
| min | 1.000000 | 1.000000 | 0.000000 | 0.000000 | 0.0 | 13.000000 | 23.000000 | 0.0 | 6.000000 | 5.000000 | ... | 0.0 | 53.630829 | 1.986327 | 53.704212 | 1.989045 | 18.981472 | 3.287124 | 3.216963 | 1.556777 | 1.558537 |
| 25% | 16.000000 | 16.000000 | 58.000000 | 58.000000 | 0.0 | 75.000000 | 75.000000 | 0.0 | 17.000000 | 20.000000 | ... | 0.0 | 1617.387451 | 6.126468 | 1617.882080 | 6.128341 | 36.568157 | 10.284315 | 10.368382 | 1.635635 | 1.617460 |
| 50% | 31.000000 | 31.000000 | 129.000000 | 113.000000 | 0.0 | 148.000000 | 136.000000 | 0.0 | 21.000000 | 23.000000 | ... | 0.0 | 3057.676758 | 7.606161 | 3057.704346 | 7.606230 | 39.194824 | 12.852437 | 12.946156 | 1.700105 | 1.697701 |
| 75% | 46.000000 | 46.000000 | 199.000000 | 166.000000 | 0.0 | 212.000000 | 196.000000 | 0.0 | 25.000000 | 28.000000 | ... | 0.0 | 4890.122070 | 9.136268 | 4891.035156 | 9.135794 | 43.016975 | 15.419342 | 15.526697 | 1.791790 | 1.802883 |
| max | 61.000000 | 61.000000 | 250.000000 | 249.000000 | 0.0 | 255.000000 | 253.000000 | 0.0 | 42.000000 | 52.000000 | ... | 0.0 | 13825.639648 | 13.825640 | 13824.682617 | 13.824682 | 51.311035 | 26.949856 | 27.543896 | 2.234677 | 2.248647 |
8 rows × 37 columns