Smoothing labels#

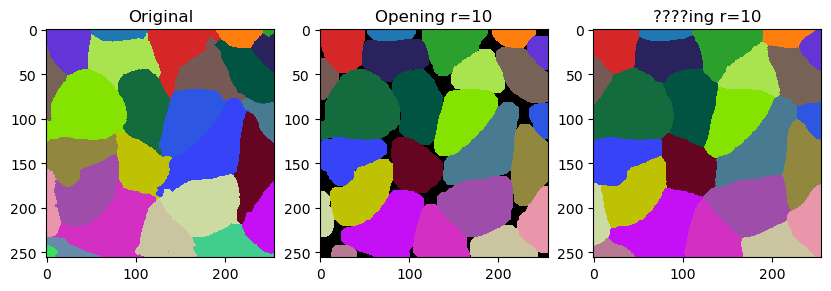
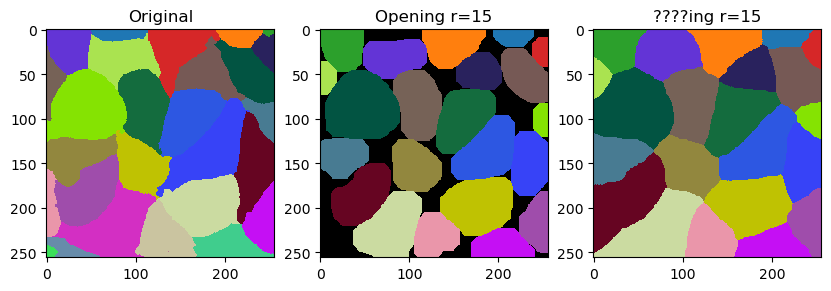
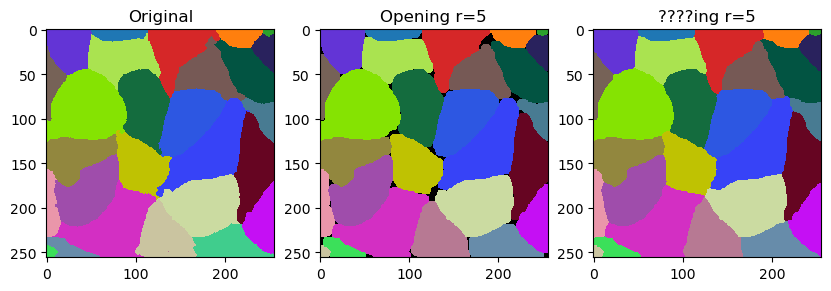
In this notebook we will demonstrate how to fine-tune outlines of labels by smoothing them. The operation is related to erosion and dilation of labels. It is however not exactly what opening does. It differs by not leaving gaps behind but filling them with the closes labels.

import numpy as np
import pyclesperanto_prototype as cle
import matplotlib.pyplot as plt

A potential use-case is fine-tuning cell segmentation results. Thus, we take a look at a segmentation of cells based on membranes.

membranes = cle.imread("../../data/membranes.tif")
membranes
cle._ image
shape(256, 256)
dtypefloat32
size256.0 kB
min277.0
max44092.0
labels = cle.imread("../../data/membranes_labeled.tif").astype(np.uint32)
labels
cle._ image
shape(256, 256)
dtypeuint32
size256.0 kB
min1.0
max28.0

The smooth_labels function allows to straighten the outlines of the labels.

cle.smooth_labels(labels, radius=5)
cle._ image
shape(256, 256)
dtypeuint32
size256.0 kB
min1.0
max27.0

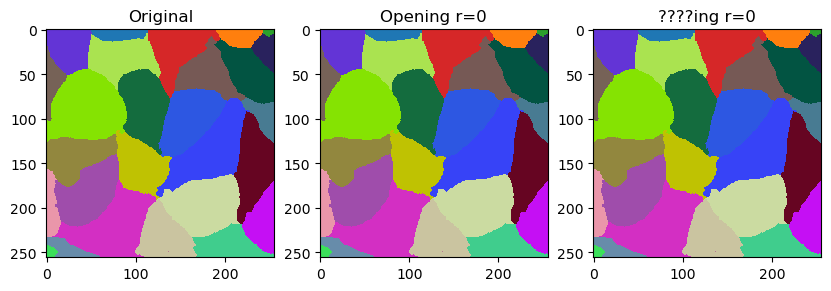
The following code block is a modified version of the code that was used to generate the video in this tweet where we discussed the name of the filter.
# for r in range(20):
for r in range(0, 20, 5):
    print("radius =", r)
    
    fig, ax = plt.subplots(1,3, figsize=(10,10))
    
    cle.imshow(labels, labels=True, plot=ax[0])
    cle.imshow(cle.opening_labels(labels, radius=r), labels=True, plot=ax[1])
    cle.imshow(cle.smooth_labels(labels, radius=r), labels=True, plot=ax[2])
    
    ax[0].set_title("Original")
    ax[1].set_title("Opening r=" + str(r))
    ax[2].set_title("????ing r=" + str(r))
    # plt.savefig("temp/" + str(r).zfill(2) + ".tif", dpi=300)
    plt.show()
radius = 0
../_images/361a39674a56a5d051e590c8194da01d1a2f14bfdeef27ba9ba0d0d19222fd93.png
radius = 5
../_images/2a2c94ed07e8c47f9dc80a3816d6e911ec7690188780dba0f154324c1e4ee4c3.png
radius = 10
../_images/4ee5ec16565df52055bc5cd952ad14faa90268a66cfd969d9df7349b03e62233.png
radius = 15
../_images/eadac7f05657e79c72483f77d3cb8c69154fb6d66a632f0e94e015b7cf1abb1b.png