Unsupervised machine learning#
Unsupervised machine learning is a technique for configuring (learning) parameters of a computational model based on no annotation but additional information such as number of categories to differentiate. Many algorithms in this category perform data clustering.
See also
import matplotlib.pyplot as plt
import pandas as pd
from sklearn.cluster import KMeans

# local import; this library is located in the same folder as the notebook
from data_generator import generate_biomodal_2d_data
Our starting point for demonstrating supervised machine learning is a a pair of measurements in a bimodal distribution. In the following data set objects with a larger area are typically also more elongated.
data = generate_biomodal_2d_data()

plt.scatter(data[:, 0], data[:, 1], c='grey')
<matplotlib.collections.PathCollection at 0x7fd53c2d7c70>
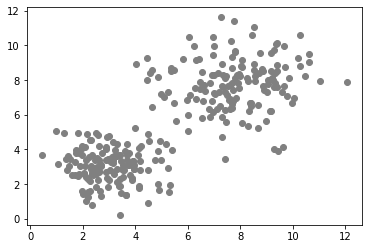
In case of unsupervised machine learning algorithms, we need to provide additional information to the algorithm so that it can separate (cluster) the data points into regions meaningfully. What information we provide depends on the algorithm and on the distribution of the data. Typically, we select the algorithm depending on the data. In the example above, we can clearly see two clusters, it is a bimodal distribution. In that case, we can specify the number of classes to differentiate:
number_of_classes = 2
Initializing k-means clustering#
k-mean clustering is an algorithm that clusters data points into k clusters so that all data points are assigned to the closest center of the clusters.
Clustering algorithms in scikit-learn typically have a fit() function that consumes a data set as given above.
classifier = KMeans(n_clusters=number_of_classes)
classifier.fit(data)
KMeans(n_clusters=2)
Prediction#
Afte the model is trained (or fitted), we can apply it to our data to retrieve a prediction to which cluster the data points belong. Indexing of clusters starts at 0. Thus, if we asked to differentiate two clusters, the cluster indices are 0 and 1:
prediction = classifier.predict(data)
prediction
array([0, 0, 1, 0, 0, 0, 1, 1, 0, 0, 1, 0, 0, 1, 0, 1, 1, 1, 1, 1, 0, 0,
       0, 0, 1, 0, 1, 0, 1, 0, 1, 1, 0, 1, 1, 0, 0, 1, 0, 0, 0, 0, 1, 0,
       1, 1, 1, 1, 1, 0, 0, 0, 1, 0, 1, 0, 1, 0, 1, 0, 1, 0, 0, 1, 1, 1,
       1, 0, 0, 0, 0, 1, 0, 0, 1, 1, 1, 0, 0, 1, 1, 0, 1, 1, 1, 0, 0, 0,
       1, 0, 1, 0, 1, 0, 1, 0, 1, 1, 0, 1, 0, 0, 1, 0, 0, 1, 0, 1, 0, 1,
       0, 1, 1, 1, 0, 1, 1, 1, 1, 1, 1, 0, 1, 1, 0, 0, 0, 1, 1, 1, 0, 1,
       1, 1, 0, 1, 0, 1, 1, 0, 1, 1, 1, 0, 1, 0, 0, 1, 1, 1, 0, 0, 0, 0,
       0, 0, 1, 0, 0, 0, 0, 1, 0, 0, 1, 1, 1, 0, 0, 0, 0, 1, 1, 0, 0, 0,
       0, 1, 1, 0, 1, 0, 0, 1, 1, 0, 1, 1, 0, 1, 0, 1, 0, 1, 1, 1, 0, 1,
       0, 1, 0, 0, 1, 1, 1, 0, 0, 0, 1, 1, 0, 1, 0, 1, 0, 1, 0, 0, 1, 0,
       0, 1, 0, 0, 1, 1, 1, 0, 0, 0, 1, 1, 1, 1, 1, 0, 1, 0, 0, 1, 1, 1,
       0, 0, 1, 0, 0, 1, 0, 1, 1, 1, 0, 0, 1, 1, 0, 0, 0, 1, 1, 0, 0, 0,
       0, 0, 1, 1, 0, 0, 0, 0, 0, 0, 1, 1, 1, 0, 0, 1, 1, 1, 0, 1, 0, 1,
       1, 0, 1, 1, 0, 1, 1, 0, 0, 1, 0, 0, 1, 1], dtype=int32)
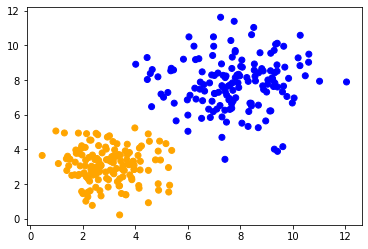
We can then visualize all the predicted classes in colors.
colors = ['orange', 'blue']
predicted_colors = [colors[i] for i in prediction]

plt.scatter(data[:, 0], data[:, 1], c=predicted_colors)
<matplotlib.collections.PathCollection at 0x7fd4d8018d30>
Exercise#
Train a Gaussian Mixture Model and visualize its prediction.
from sklearn.mixture import GaussianMixture

classifier = GaussianMixture(n_components=2)