Visualizing surfaces#
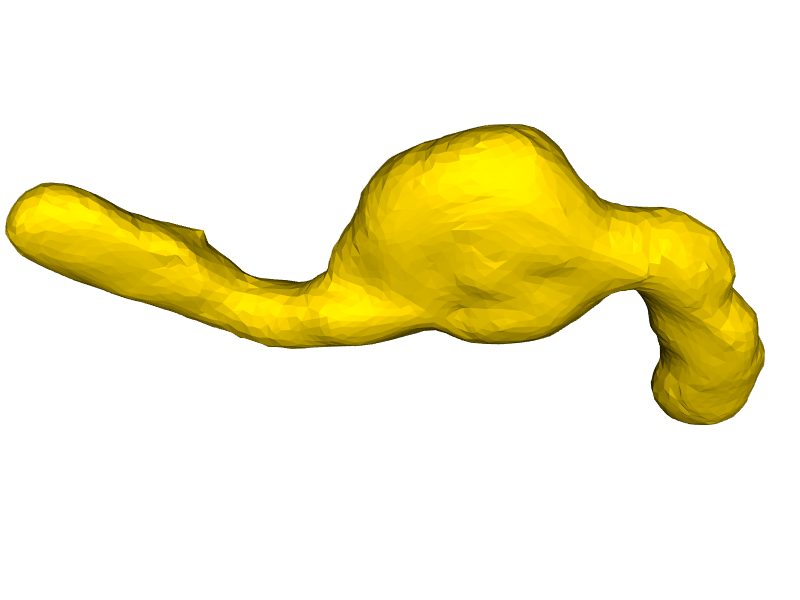
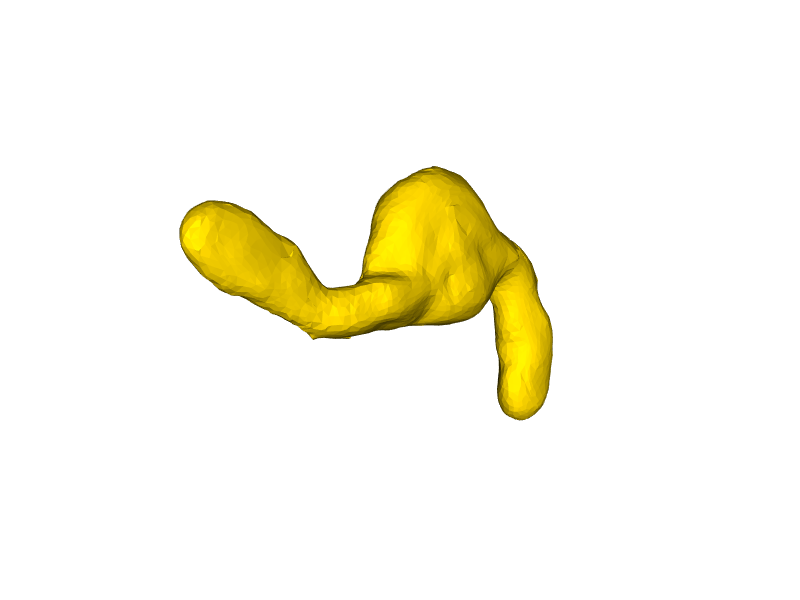
In this notebook we create a surface mesh from a 3D dataset of a Gastruloid. The used example data is derived from AV Luque and JV Veenvliet (2023) licensed CC-BY. See the creating_surfaces for how to create the surface from raw imaging data.
We visualize the surface using napari-process-points-and-surfaces, vedo and napari.
import napari_process_points_and_surfaces as nppas

import vedo
import napari
surface = nppas.gastruloid()
The nppas gastruloid example is derived from AV Luque and JV Veenvliet (2023) which is licensed CC-BY (https://creativecommons.org/licenses/by/4.0/legalcode) and can be downloaded from here: https://zenodo.org/record/7603081
The resulting object is visualized in Jupyter notebooks like this:
surface
|
|
nppas.SurfaceTuple
|
surface2 = nppas.add_quality(surface, nppas.Quality.SPHERE_FITTED_CURVATURE_HECTA_VOXEL)
surface2.azimuth = -90
surface2
|
|
nppas.SurfaceTuple
|
Visualizing surfaces using napari-process-points-and-surfaces nazimuths.show()#
You can tune the visualization using nppas.show().
nppas.show(surface, zoom=1.5, azimuth=90, elevation=45)

Visualizing surfaces using vedo#
… using vedo Plotter.
from vedo import Plotter

plt = Plotter()
mesh = nppas.to_vedo_mesh(surface)

plt.show(mesh, zoom=1, azimuth=45)

Visualizing surfaces using napari#
import napari
viewer = napari.Viewer(ndisplay=3)

viewer.add_surface(surface)

napari.utils.nbscreenshot(viewer)
viewer.add_surface(surface2, colormap=surface2.cmap)

napari.utils.nbscreenshot(viewer)
