Seeded watershed for membrane-based cell segmentation
In this section we will use a seeded watershed approach to cell segmentation. This approach is very common when cell segmentation based on images of membrane markers are given. Therefore, we use the napari plugin napari-segment-blobs-and-things-with-membranes. Under the hood, this plugins uses functions from scikit-image.
See also
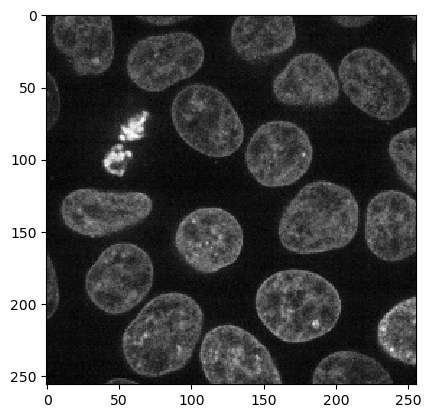
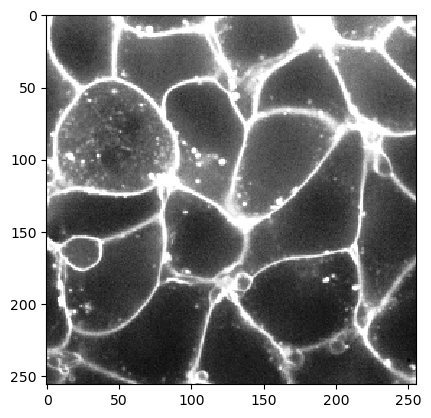
We load the Cells3d example image from scikit-image which is a two-channel image showing nuclei and membrains.
Voronoi-Otsu-Labeling for nuclei segmentation
First, we start with segmenting the nuclei using the Voronoi-Otsu-Labeling algorithm.

|
nsbatwm made image
| shape | (256, 256) |
| dtype | int32 |
| size | 256.0 kB |
| min | 0 | | max | 25 |
|
Seeded watershed
We can use the image of labeled nuclei as starting point for flooding the low-intensity areas in the membrane image. This allows us to determine a cell segmentation.

|
nsbatwm made image
| shape | (256, 256) |
| dtype | int32 |
| size | 256.0 kB |
| min | 1 | | max | 25 |
|
If the outlines of the cells are not 100% accurate, it may make sense to blur the membrane image a bit before segmenting the cells.

|
nsbatwm made image
| shape | (256, 256) |
| dtype | int32 |
| size | 256.0 kB |
| min | 1 | | max | 25 |
|
Seeded watershed using automatic seed detection
In case we didn’t image a separate nuclei channel and only have the membrane channel available for segmentation, we can use the membrane image to search for local minima (dark areas).

|
nsbatwm made image
| shape | (256, 256) |
| dtype | int32 |
| size | 256.0 kB |
| min | 1 | | max | 27 |
|
This function also has some parameters to allow fine tuning the segmentation. The parameter outline_sigma allows to control a Gaussian blur filter that allows fine-tuning the outlines of the segmented cells as shown above.

|
nsbatwm made image
| shape | (256, 256) |
| dtype | int32 |
| size | 256.0 kB |
| min | 1 | | max | 27 |
|
If there are multiple cells sticking together, it may make sense to specify spot_sigma. This parameter allows to configure how close / large cells are.

|
nsbatwm made image
| shape | (256, 256) |
| dtype | int32 |
| size | 256.0 kB |
| min | 1 | | max | 28 |
|
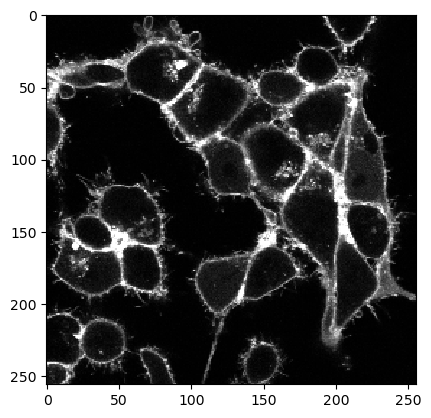
Exercise
Load the following dataset and find good parameters for processing it using a seeded watershed approach. This example image data is a courtesy of Sascha M. Kuhn, Nadler Lab, MPI-CBG Dresden.