Image segmentation#
Image segmentation is the process of separating an image into multiple regions.
See also
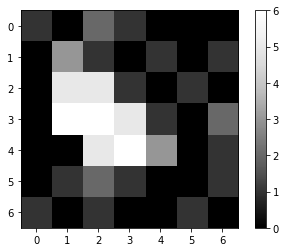
Let’s start again by defining an image as a two dimensional array and visualize it using pyclesperanto.
import numpy as np
from pyclesperanto_prototype import imshow
import matplotlib.pyplot as plt
image = np.asarray([
    [1, 0, 2, 1, 0, 0, 0],
    [0, 3, 1, 0, 1, 0, 1],
    [0, 5, 5, 1, 0, 1, 0],
    [0, 6, 6, 5, 1, 0, 2],
    [0, 0, 5, 6, 3, 0, 1],
    [0, 1, 2, 1, 0, 0, 1],
    [1, 0, 1, 0, 0, 1, 0]
])
imshow(image, colorbar=True)
Binary images#
The most basic way of that is binarization, turning the image into a “positive” and a “negative” region. Typically, binary images are used for that, which could for example contain two different pixel values True and False representing “positive” and “negative”, respectively. Technically, every image can be interpreted as a binary image using the rationale “Every pixel is considered positive that is neither False nor 0.”
Image thresholding#
A very basic algorithm for separating low intensity regions from high intensity regions in the image is thresholding.
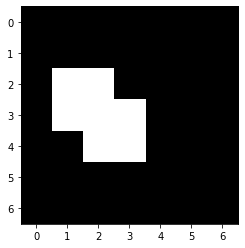
We will now make a new image containing True and False as pixel values depending on if the original image had intensity lower or higher a given threshold. As this image has just two different pixel values, it is a binary image:
threshold = 4

binary_image = image > threshold
binary_image
array([[False, False, False, False, False, False, False],
       [False, False, False, False, False, False, False],
       [False,  True,  True, False, False, False, False],
       [False,  True,  True,  True, False, False, False],
       [False, False,  True,  True, False, False, False],
       [False, False, False, False, False, False, False],
       [False, False, False, False, False, False, False]])
imshow(binary_image)
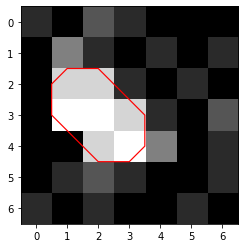
Matplotlib might be more flexible when visualizing images, e.g. for drawing outlines around regions of interest:
# create a new plot
fig, axes = plt.subplots(1,1)

# add two images
axes.imshow(image, cmap=plt.cm.gray)
axes.contour(binary_image, [0.5], linewidths=1.2, colors='r')
<matplotlib.contour.QuadContourSet at 0x1a542ce37f0>