Opening CZI files#
When working with microscopy image data, many file formats are circulating such as the Carl Zeiss Image (CZI) format. In this notebook, we will open a .czi file using the czifile library.
Note: It is recommended to use AICSImageIO for reading CZI files as shown in this notebook.
See also
import czifile

from pathlib import Path
from skimage.io import imshow
import numpy as np
We can open an image usually by providing a path to it to an imread function. In the following we are using an image showing a Drosophila wing during pupal stage kindly provided by Romina Piscitello-Gómez (MPI CBG).
image = czifile.imread(Path("../../data/PupalWing.czi"))
A first good step is to inspect the dimensionality of the image.
image.shape
(1, 1, 1, 80, 520, 692, 1)
These formats usually have extra dimensions to accomodate many different data shapes. This is their common order when working with CZI files:
‘X’: ‘Width’
‘Y’: ‘Height’
‘C’: ‘Channel’
‘Z’: ‘Slice’ (depth)
‘T’: ‘Time’
‘R’: ‘Rotation’
‘S’: ‘Scene’ / contiguous regions of interest in a mosaic image
We know that our image had three dimensions when we acquired it. One trick to get rid of the unecessary extra dimensions is the np.squeeze function.
image_squeezed = np.squeeze(image)
image_squeezed.shape
(80, 520, 692)
The image is a numpy array and thus, we can work with it normally.
type(image_squeezed)
numpy.ndarray
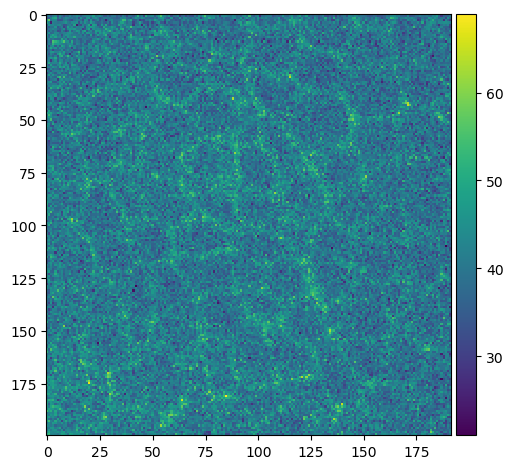
cropped_slice_image = image_squeezed[40, 200:400, 500:700]

imshow(cropped_slice_image)
C:\Users\haase\mambaforge\envs\bio39\lib\site-packages\skimage\io\_plugins\matplotlib_plugin.py:150: UserWarning: Low image data range; displaying image with stretched contrast.
  lo, hi, cmap = _get_display_range(image)
<matplotlib.image.AxesImage at 0x2347feaee50>