Counting nuclei according to expression in multiple channels#
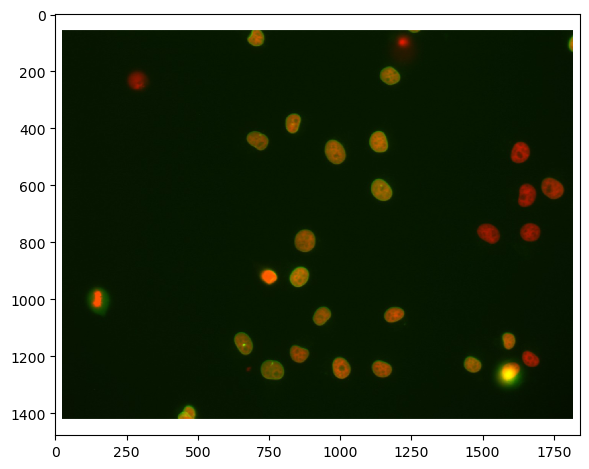
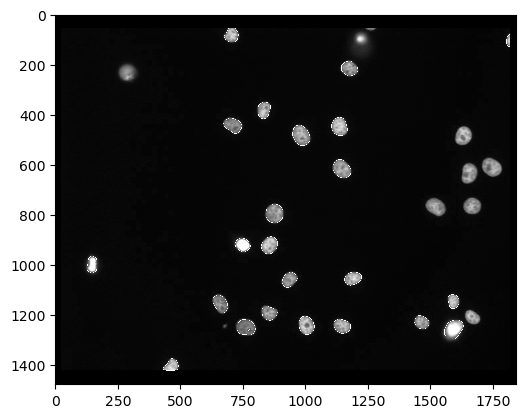
A common bio-image analysis task is counting cells according to their signal expression in multiple channels. In this example we take a two-channel image of nuclei which express Cy3 and eGFP. Visually, we can easily see that some nuclei expressing Cy3 also express eGFP, others don’t. This notebook demonstrates how to count these groups of nuclei.
import pyclesperanto_prototype as cle
import numpy as np
from skimage.io import imread, imshow
import matplotlib.pyplot as plt

cle.get_device()
<Intel(R) Iris(R) Xe Graphics on Platform: Intel(R) OpenCL HD Graphics (1 refs)>
We’re using a dataset published by Heriche et al. licensed CC BY 4.0 available in the Image Data Resource.
# load file
raw_image = imread('../../data/plate1_1_013 [Well 5, Field 1 (Spot 5)].png')

# visualize
imshow(raw_image)
<matplotlib.image.AxesImage at 0x2b453c8f700>
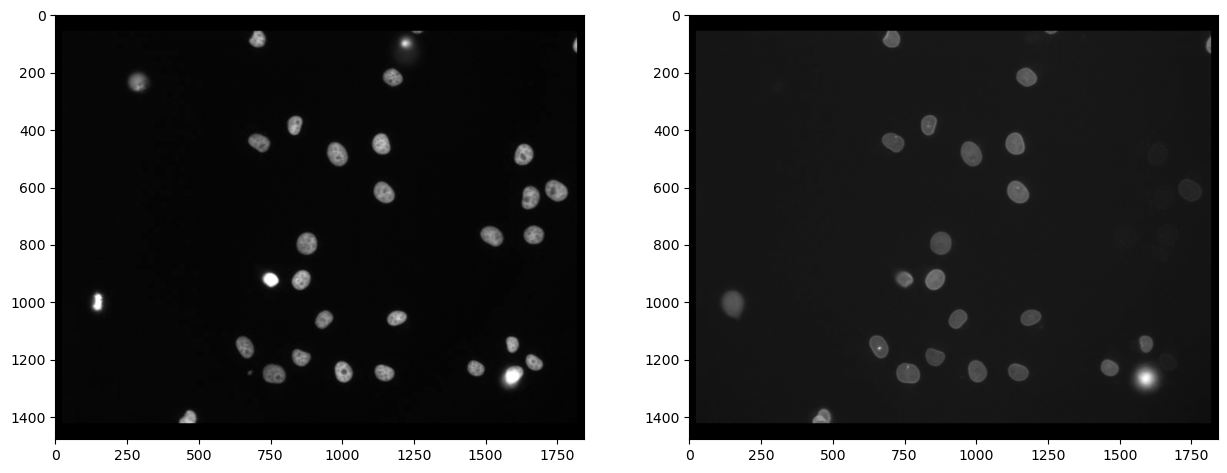
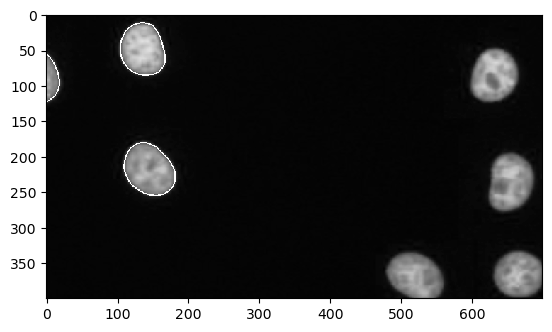
First, we need to split channels (read more). After that, we can actually see that not all cells marked with Cy3 (channel 0) are also marked with eGFP (channel 1):
# extract channels
channel_0 = raw_image[...,0]
channel_1 = raw_image[...,1]

# visualize
fig, axs = plt.subplots(1, 2, figsize=(15,15))
axs[0].imshow(channel_0, cmap='gray')
axs[1].imshow(channel_1, cmap='gray')
<matplotlib.image.AxesImage at 0x2b453c8f730>
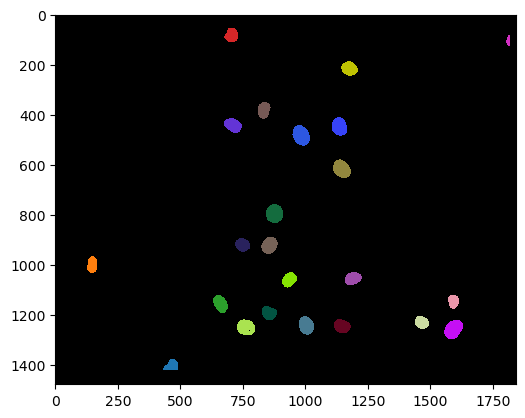
Segmenting nuclei#
As the staining marks the whole nucleus in both cases, it is reasonable to segment nuclei in both images and then process the segmented images further. We use Voronoi-Otsu-Labeling for the segmentation because it is a quick and straightforward approach.
# segmentation
nuclei_cy3 = cle.voronoi_otsu_labeling(channel_0, spot_sigma=20)
nuclei_egfp = cle.voronoi_otsu_labeling(channel_1, spot_sigma=20)

# visualize
fig, axs = plt.subplots(1, 2, figsize=(15,15))
cle.imshow(nuclei_cy3, plot=axs[0], labels=True)
cle.imshow(nuclei_egfp, plot=axs[1], labels=True)

The above shown label images have inside nuclei pixel intensity values that correspond to the number of the nucleus. In nucleus 1, all pixels have intensity 1. In nucleus 2, all pixels have intensity 2 and so on. Hence, from these label images, we can already determine the number of nuclei in both channels, by measuring the maximum intensity in the label images:
# determine maximum in both label images
number_of_nuclei_cy3 = nuclei_cy3.max()
number_of_nuclei_egfp = nuclei_egfp.max()

# print out result
print("Nuclei Cy3 positive:", number_of_nuclei_cy3)
print("Nuclei eGFP positive:", number_of_nuclei_egfp)
Nuclei Cy3 positive: 31.0
Nuclei eGFP positive: 23.0
Technically, we haven’t checked yet if all eGFP positive nuclei are also Cy3 positive. We can do this by determining how many eGFP positive nuclei are close by each individual Cy3 positive nucleus. Therefore, we need to set a maximum distance threshold allowing us to specify how far away centroids of nuclei are allowed to be.
maximum_distance = 15 # pixels

# draw a parametric map of cell counts
count_map = cle.proximal_other_labels_count_map(nuclei_cy3, nuclei_egfp)
cle.imshow(count_map, colorbar=True)
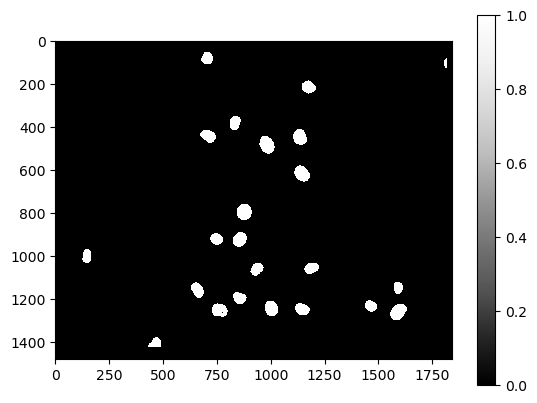
The count_map is a parametric image. We can identify all the nuclei where the count value >= 1. These are all the Cy3-positive nuclei which have at least one eGFP-positive nucleus with a centroid distance <= 15 pixels.
double_positive_nuclei = cle.exclude_labels_with_map_values_out_of_range(
    count_map,
    nuclei_cy3,
    minimum_value_range=1)

cle.imshow(double_positive_nuclei, labels=True)
And we can also count those similar to shown above:
number_of_double_positives = double_positive_nuclei.max()
print("Number of Cy3 positives that also express eGFP", number_of_double_positives)
Number of Cy3 positives that also express eGFP 23.0
Visualization#
We can also use the outlines around cells which are double positive and visualize those on the original images of both channels.
# determine outlines
outlines = cle.detect_label_edges(double_positive_nuclei)

# add outlines to original images. As outlines have value 1,
# we need to multiply them to make them properly visible:
channel_0_with_outlines = cle.maximum_images(channel_0, outlines * channel_0.max())

# visualize result
cle.imshow(channel_0_with_outlines)

# let's zoom in
cle.imshow(channel_0_with_outlines.get()[400:800, 1000:1700])
For interactive visualization, we can also use napari:
# startup a viewer
import napari
viewer = napari.Viewer()

# add raw images in color to the viewer
viewer.add_image(channel_0, colormap='magenta')
viewer.add_image(channel_1, colormap='green', blending='additive')

# add labels and configure it so that we see the contours as thick lines
labels_layer = viewer.add_labels(double_positive_nuclei)
labels_layer.contour=5

# make a screenshot of the viewer
napari.utils.nbscreenshot(viewer)

References#
Some of the functions we used might be uncommon. Hence, we can add their documentation for reference.
print(cle.voronoi_otsu_labeling.__doc__)
Labels objects directly from grey-value images.

    The two sigma parameters allow tuning the segmentation result. Under the hood,
    this filter applies two Gaussian blurs, spot detection, Otsu-thresholding [2] and Voronoi-labeling [3]. The
    thresholded binary image is flooded using the Voronoi tesselation approach starting from the found local maxima.

    Notes
    -----
    * This operation assumes input images are isotropic.

    Parameters
    ----------
    source : Image
        Input grey-value image
    label_image_destination : Image, optional
        Output image
    spot_sigma : float, optional
        controls how close detected cells can be
    outline_sigma : float, optional
        controls how precise segmented objects are outlined.

    Returns
    -------
    label_image_destination

    Examples
    --------
    >>> import pyclesperanto_prototype as cle
    >>> cle.voronoi_otsu_labeling(source, label_image_destination, 10, 2)

    References
    ----------
    .. [1] https://clij.github.io/clij2-docs/reference_voronoiOtsuLabeling
    .. [2] https://ieeexplore.ieee.org/document/4310076
    .. [3] https://en.wikipedia.org/wiki/Voronoi_diagram
print(cle.proximal_other_labels_count_map.__doc__)
    Count number of labels within a given radius in an other label image and returns the result as parametric map.

    Parameters
    ----------
    label_image: Image
    other_label_image: Image
    count_map: Image, optional
        parametric image where the values will be written in.
    maximum_distance: Number, optional
        maximum distance in pixels

    Returns
    -------
    count_map
print(cle.exclude_labels_with_map_values_out_of_range.__doc__)
This operation removes labels from a labelmap and renumbers the
    remaining labels.

    Notes
    -----
    * Values of all pixels in a label each must be identical.

    Parameters
    ----------
    values_map : Image
    label_map_input : Image
    label_map_destination : Image, optional
    minimum_value_range : Number, optional
    maximum_value_range : Number, optional

    Returns
    -------
    label_map_destination

    References
    ----------
    .. [1] https://clij.github.io/clij2-docs/reference_excludeLabelsWithValuesWithinRange
print(cle.detect_label_edges.__doc__)
Takes a labelmap and returns an image where all pixels on label edges
    are set to 1 and all other pixels to 0.

    Parameters
    ----------
    label_map : Image
    edge_image_destination : Image, optional

    Returns
    -------
    edge_image_destination

    Examples
    --------
    >>> import pyclesperanto_prototype as cle
    >>> cle.detect_label_edges(label_map, edge_image_destination)

    References
    ----------
    .. [1] https://clij.github.io/clij2-docs/reference_detectLabelEdges
print(cle.maximum_images.__doc__)
Computes the maximum of a pair of pixel values x, y from two given
    images X and Y.

    <pre>f(x, y) = max(x, y)</pre>

    Parameters
    ----------
    source1 : Image
    source2 : Image
    destination : Image, optional

    Returns
    -------
    destination

    Examples
    --------
    >>> import pyclesperanto_prototype as cle
    >>> cle.maximum_images(source1, source2, destination)

    References
    ----------
    .. [1] https://clij.github.io/clij2-docs/reference_maximumImages
print(napari.Viewer.__doc__)
Napari ndarray viewer.

    Parameters
    ----------
    title : string, optional
        The title of the viewer window. by default 'napari'.
    ndisplay : {2, 3}, optional
        Number of displayed dimensions. by default 2.
    order : tuple of int, optional
        Order in which dimensions are displayed where the last two or last
        three dimensions correspond to row x column or plane x row x column if
        ndisplay is 2 or 3. by default None
    axis_labels : list of str, optional
        Dimension names. by default they are labeled with sequential numbers
    show : bool, optional
        Whether to show the viewer after instantiation. by default True.
print(napari.Viewer.add_image.__doc__)
Add an image layer to the layer list.

        Parameters
        ----------
        data : array or list of array
            Image data. Can be N >= 2 dimensional. If the last dimension has length
            3 or 4 can be interpreted as RGB or RGBA if rgb is `True`. If a
            list and arrays are decreasing in shape then the data is treated as
            a multiscale image. Please note multiscale rendering is only
            supported in 2D. In 3D, only the lowest resolution scale is
            displayed.
        channel_axis : int, optional
            Axis to expand image along.  If provided, each channel in the data
            will be added as an individual image layer.  In channel_axis mode,
            all other parameters MAY be provided as lists, and the Nth value
            will be applied to the Nth channel in the data.  If a single value
            is provided, it will be broadcast to all Layers.
        rgb : bool or list
            Whether the image is rgb RGB or RGBA. If not specified by user and
            the last dimension of the data has length 3 or 4 it will be set as
            `True`. If `False` the image is interpreted as a luminance image.
            If a list then must be same length as the axis that is being
            expanded as channels.
        colormap : str, napari.utils.Colormap, tuple, dict, list
            Colormaps to use for luminance images. If a string must be the name
            of a supported colormap from vispy or matplotlib. If a tuple the
            first value must be a string to assign as a name to a colormap and
            the second item must be a Colormap. If a dict the key must be a
            string to assign as a name to a colormap and the value must be a
            Colormap. If a list then must be same length as the axis that is
            being expanded as channels, and each colormap is applied to each
            new image layer.
        contrast_limits : list (2,)
            Color limits to be used for determining the colormap bounds for
            luminance images. If not passed is calculated as the min and max of
            the image. If list of lists then must be same length as the axis
            that is being expanded and then each colormap is applied to each
            image.
        gamma : list, float
            Gamma correction for determining colormap linearity. Defaults to 1.
            If a list then must be same length as the axis that is being
            expanded as channels.
        interpolation : str or list
            Interpolation mode used by vispy. Must be one of our supported
            modes. If a list then must be same length as the axis that is being
            expanded as channels.
        rendering : str or list
            Rendering mode used by vispy. Must be one of our supported
            modes. If a list then must be same length as the axis that is being
            expanded as channels.
        depiction : str
            Selects a preset volume depiction mode in vispy
              * volume: images are rendered as 3D volumes.
              * plane: images are rendered as 2D planes embedded in 3D.
        iso_threshold : float or list
            Threshold for isosurface. If a list then must be same length as the
            axis that is being expanded as channels.
        attenuation : float or list
            Attenuation rate for attenuated maximum intensity projection. If a
            list then must be same length as the axis that is being expanded as
            channels.
        name : str or list of str
            Name of the layer.  If a list then must be same length as the axis
            that is being expanded as channels.
        metadata : dict or list of dict
            Layer metadata. If a list then must be a list of dicts with the
            same length as the axis that is being expanded as channels.
        scale : tuple of float or list
            Scale factors for the layer. If a list then must be a list of
            tuples of float with the same length as the axis that is being
            expanded as channels.
        translate : tuple of float or list
            Translation values for the layer. If a list then must be a list of
            tuples of float with the same length as the axis that is being
            expanded as channels.
        rotate : float, 3-tuple of float, n-D array or list.
            If a float convert into a 2D rotation matrix using that value as an
            angle. If 3-tuple convert into a 3D rotation matrix, using a yaw,
            pitch, roll convention. Otherwise assume an nD rotation. Angles are
            assumed to be in degrees. They can be converted from radians with
            np.degrees if needed. If a list then must have same length as
            the axis that is being expanded as channels.
        shear : 1-D array or list.
            A vector of shear values for an upper triangular n-D shear matrix.
            If a list then must have same length as the axis that is being
            expanded as channels.
        affine : n-D array or napari.utils.transforms.Affine
            (N+1, N+1) affine transformation matrix in homogeneous coordinates.
            The first (N, N) entries correspond to a linear transform and
            the final column is a length N translation vector and a 1 or a
            napari `Affine` transform object. Applied as an extra transform on
            top of the provided scale, rotate, and shear values.
        opacity : float or list
            Opacity of the layer visual, between 0.0 and 1.0.  If a list then
            must be same length as the axis that is being expanded as channels.
        blending : str or list
            One of a list of preset blending modes that determines how RGB and
            alpha values of the layer visual get mixed. Allowed values are
            {'opaque', 'translucent', and 'additive'}. If a list then
            must be same length as the axis that is being expanded as channels.
        visible : bool or list of bool
            Whether the layer visual is currently being displayed.
            If a list then must be same length as the axis that is
            being expanded as channels.
        multiscale : bool
            Whether the data is a multiscale image or not. Multiscale data is
            represented by a list of array like image data. If not specified by
            the user and if the data is a list of arrays that decrease in shape
            then it will be taken to be multiscale. The first image in the list
            should be the largest. Please note multiscale rendering is only
            supported in 2D. In 3D, only the lowest resolution scale is
            displayed.
        cache : bool
            Whether slices of out-of-core datasets should be cached upon
            retrieval. Currently, this only applies to dask arrays.
        plane : dict or SlicingPlane
            Properties defining plane rendering in 3D. Properties are defined in
            data coordinates. Valid dictionary keys are
            {'position', 'normal', 'thickness', and 'enabled'}.
        experimental_clipping_planes : list of dicts, list of ClippingPlane, or ClippingPlaneList
            Each dict defines a clipping plane in 3D in data coordinates.
            Valid dictionary keys are {'position', 'normal', and 'enabled'}.
            Values on the negative side of the normal are discarded if the plane is enabled.

        Returns
        -------
        layer : :class:`napari.layers.Image` or list
            The newly-created image layer or list of image layers.
print(napari.Viewer.add_labels.__doc__)
Add a Labels layer to the layer list.

Parameters
----------
data : array or list of array
    Labels data as an array or multiscale. Must be integer type or bools.
    Please note multiscale rendering is only supported in 2D. In 3D, only
    the lowest resolution scale is displayed.
num_colors : int
    Number of unique colors to use in colormap.
features : dict[str, array-like] or DataFrame
    Features table where each row corresponds to a label and each column
    is a feature. The first row corresponds to the background label.
properties : dict {str: array (N,)} or DataFrame
    Properties for each label. Each property should be an array of length
    N, where N is the number of labels, and the first property corresponds
    to background.
color : dict of int to str or array
    Custom label to color mapping. Values must be valid color names or RGBA
    arrays.
seed : float
    Seed for colormap random generator.
name : str
    Name of the layer.
metadata : dict
    Layer metadata.
scale : tuple of float
    Scale factors for the layer.
translate : tuple of float
    Translation values for the layer.
rotate : float, 3-tuple of float, or n-D array.
    If a float convert into a 2D rotation matrix using that value as an
    angle. If 3-tuple convert into a 3D rotation matrix, using a yaw,
    pitch, roll convention. Otherwise assume an nD rotation. Angles are
    assumed to be in degrees. They can be converted from radians with
    np.degrees if needed.
shear : 1-D array or n-D array
    Either a vector of upper triangular values, or an nD shear matrix with
    ones along the main diagonal.
affine : n-D array or napari.utils.transforms.Affine
    (N+1, N+1) affine transformation matrix in homogeneous coordinates.
    The first (N, N) entries correspond to a linear transform and
    the final column is a length N translation vector and a 1 or a napari
    `Affine` transform object. Applied as an extra transform on top of the
    provided scale, rotate, and shear values.
opacity : float
    Opacity of the layer visual, between 0.0 and 1.0.
blending : str
    One of a list of preset blending modes that determines how RGB and
    alpha values of the layer visual get mixed. Allowed values are
    {'opaque', 'translucent', and 'additive'}.
rendering : str
    3D Rendering mode used by vispy. Must be one {'translucent', 'iso_categorical'}.
    'translucent' renders without lighting. 'iso_categorical' uses isosurface
    rendering to calculate lighting effects on labeled surfaces.
    The default value is 'iso_categorical'.
depiction : str
    3D Depiction mode. Must be one of {'volume', 'plane'}.
    The default value is 'volume'.
visible : bool
    Whether the layer visual is currently being displayed.
multiscale : bool
    Whether the data is a multiscale image or not. Multiscale data is
    represented by a list of array like image data. If not specified by
    the user and if the data is a list of arrays that decrease in shape
    then it will be taken to be multiscale. The first image in the list
    should be the largest. Please note multiscale rendering is only
    supported in 2D. In 3D, only the lowest resolution scale is
    displayed.
cache : bool
    Whether slices of out-of-core datasets should be cached upon retrieval.
    Currently, this only applies to dask arrays.
plane : dict or SlicingPlane
    Properties defining plane rendering in 3D. Properties are defined in
    data coordinates. Valid dictionary keys are
    {'position', 'normal', 'thickness', and 'enabled'}.
experimental_clipping_planes : list of dicts, list of ClippingPlane, or ClippingPlaneList
    Each dict defines a clipping plane in 3D in data coordinates.
    Valid dictionary keys are {'position', 'normal', and 'enabled'}.
    Values on the negative side of the normal are discarded if the plane is enabled.

Attributes
----------
data : array or list of array
    Integer label data as an array or multiscale. Can be N dimensional.
    Every pixel contains an integer ID corresponding to the region it
    belongs to. The label 0 is rendered as transparent. Please note
    multiscale rendering is only supported in 2D. In 3D, only
    the lowest resolution scale is displayed.
multiscale : bool
    Whether the data is a multiscale image or not. Multiscale data is
    represented by a list of array like image data. The first image in the
    list should be the largest. Please note multiscale rendering is only
    supported in 2D. In 3D, only the lowest resolution scale is
    displayed.
metadata : dict
    Labels metadata.
num_colors : int
    Number of unique colors to use in colormap.
features : Dataframe-like
    Features table where each row corresponds to a label and each column
    is a feature. The first row corresponds to the background label.
properties : dict {str: array (N,)}, DataFrame
    Properties for each label. Each property should be an array of length
    N, where N is the number of labels, and the first property corresponds
    to background.
color : dict of int to str or array
    Custom label to color mapping. Values must be valid color names or RGBA
    arrays.
seed : float
    Seed for colormap random generator.
opacity : float
    Opacity of the labels, must be between 0 and 1.
contiguous : bool
    If `True`, the fill bucket changes only connected pixels of same label.
n_edit_dimensions : int
    The number of dimensions across which labels will be edited.
contour : int
    If greater than 0, displays contours of labels instead of shaded regions
    with a thickness equal to its value.
brush_size : float
    Size of the paint brush in data coordinates.
selected_label : int
    Index of selected label. Can be greater than the current maximum label.
mode : str
    Interactive mode. The normal, default mode is PAN_ZOOM, which
    allows for normal interactivity with the canvas.

    In PICK mode the cursor functions like a color picker, setting the
    clicked on label to be the current label. If the background is picked it
    will select the background label `0`.

    In PAINT mode the cursor functions like a paint brush changing any
    pixels it brushes over to the current label. If the background label
    `0` is selected than any pixels will be changed to background and this
    tool functions like an eraser. The size and shape of the cursor can be
    adjusted in the properties widget.

    In FILL mode the cursor functions like a fill bucket replacing pixels
    of the label clicked on with the current label. It can either replace
    all pixels of that label or just those that are contiguous with the
    clicked on pixel. If the background label `0` is selected than any
    pixels will be changed to background and this tool functions like an
    eraser.

    In ERASE mode the cursor functions similarly to PAINT mode, but to
    paint with background label, which effectively removes the label.
plane : SlicingPlane
    Properties defining plane rendering in 3D.
experimental_clipping_planes : ClippingPlaneList
    Clipping planes defined in data coordinates, used to clip the volume.

Notes
-----
_selected_color : 4-tuple or None
    RGBA tuple of the color of the selected label, or None if the
    background label `0` is selected.

Returns
-------
layer : :class:`napari.layers.Labels`
    The newly-created labels layer.