Count touching neighbors#
In this notebook we visualize which cells in a tissue are neighbors by drawing a mesh. Furthermore, we can change the intensity of the mesh so that it corresponds to the distance between the centroids of the cells.
import pyclesperanto_prototype as cle
import numpy as np
import pandas as pd
Test data#
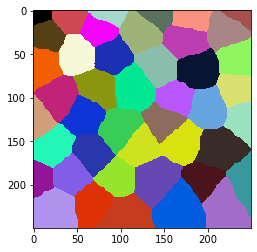
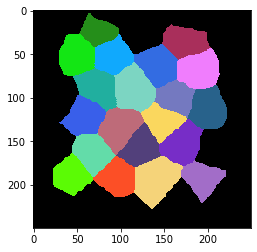
Let’s generate some tissue-like structure consisting of cells which typically have approximately 6 neighbors.
cells = cle.artificial_tissue_2d(
    delta_x=48,
    delta_y=32,
    random_sigma_x=7,
    random_sigma_y=7,
    width=250,
    height=250)

cle.imshow(cells, labels=True)
Mesh between neighboring cells#
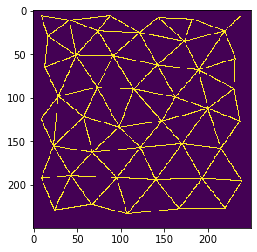
Before counting neighbors, we should visualize neighbor-relationships. We can do this by drawing a mesh between centroids of touching neighbor cells.
mesh = cle.draw_mesh_between_touching_labels(cells)

cle.imshow(mesh)
We can also combine both visualizations in one image. Note, these images should not be used any further for quantitative analysis. It just serves visualization purposes.
Centroid connections and cell borders#
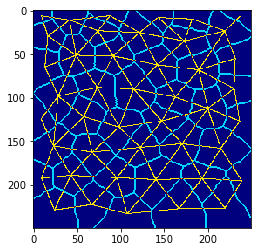
A common way for visualizing tissues in this context is by drawing cell-borders and the centroid mesh in different colours.
visualization = mesh * 2 + cle.detect_label_edges(cells)

cle.imshow(visualization, color_map='jet')
Analyze and visualize number of touching neighbors#
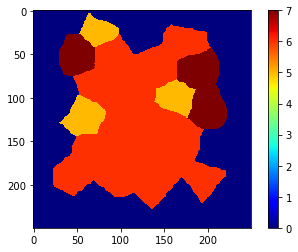
We can also count the touching neighbors and visualize the result as parametric image in colours.
neighbor_count_image = cle.touching_neighbor_count_map(cells)

cle.imshow(neighbor_count_image, color_map='jet', colorbar=True, min_display_intensity=0)
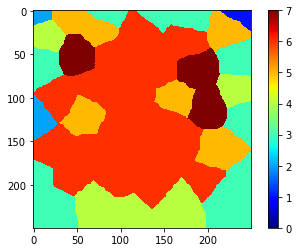
Note, the numbers along the image border may not be accurate. Hence, we should exclude the corresponding cells from the further analysis.
cells_ex_border = cle.exclude_labels_on_edges(cells)

cle.imshow(cells_ex_border, labels=True)
After correcting the label image, we can also correct the parametric image.
neighbor_count_image_ex_border = neighbor_count_image * (cells_ex_border != 0)

cle.imshow(neighbor_count_image_ex_border, color_map='jet', colorbar=True, min_display_intensity=0)
Now, we can measure the number of neighbors. We can either just read those numbers and put them in a list …
cle.read_intensities_from_map(cells_ex_border, neighbor_count_image_ex_border)
cl.Array([[0., 5., 6., 7., 6., 6., 7., 6., 6., 5., 5., 6., 6., 7., 6., 6.,
        6., 6., 6., 6., 6.]], dtype=float32)
… we can also read these values together with all other statistics and put them in a pandas DataFrame.
statistics = cle.statistics_of_labelled_pixels(neighbor_count_image_ex_border, cells_ex_border)

table = pd.DataFrame(statistics)

# rename a column
table = table.rename(columns={"mean_intensity": "number_of_neighbors"})

# only filter out a subset of all columns; only what we care
table = table[["label", "number_of_neighbors", "centroid_x", "centroid_y"]]

table
| label | number_of_neighbors | centroid_x | centroid_y | |
|---|---|---|---|---|
| 0 | 1 | 5.0 | 74.592697 | 23.731028 |
| 1 | 2 | 6.0 | 173.741379 | 35.582230 |
| 2 | 3 | 7.0 | 49.460915 | 51.928082 |
| 3 | 4 | 6.0 | 91.783768 | 52.666199 |
| 4 | 5 | 6.0 | 142.728210 | 62.962471 |
| 5 | 6 | 7.0 | 189.973206 | 68.526794 |
| 6 | 7 | 6.0 | 73.699181 | 88.797356 |
| 7 | 8 | 6.0 | 115.321083 | 90.665649 |
| 8 | 9 | 5.0 | 163.097733 | 99.824242 |
| 9 | 10 | 5.0 | 58.206852 | 122.341309 |
| 10 | 11 | 6.0 | 98.847565 | 134.280228 |
| 11 | 12 | 6.0 | 147.731705 | 127.326218 |
| 12 | 13 | 7.0 | 200.522903 | 112.817368 |
| 13 | 14 | 6.0 | 67.880905 | 162.991592 |
| 14 | 15 | 6.0 | 122.943306 | 157.515717 |
| 15 | 16 | 6.0 | 171.010025 | 153.333328 |
| 16 | 17 | 6.0 | 43.426266 | 189.492981 |
| 17 | 18 | 6.0 | 96.272728 | 192.326477 |
| 18 | 19 | 6.0 | 140.815964 | 194.446030 |
| 19 | 20 | 6.0 | 193.817596 | 193.019318 |
Exercise#
Analyze a larger field of view with more cells and vary the parameters random_sigma_x and random_sigma_y of the artificial_tissue_2d function. Use a touching-neighbor-count map to count the number of touching neighbors before and after applying a median filter to the map.